Grafana Tempo
Tracetest fetches traces from Tempo on the default gRPC port 9095, or default HTTP port 80.
Examples of configuring Tracetest can be found in the examples folder of the Tracetest GitHub repo.
Configure Tempo
Tempo uses port 9095 as the default grpc_listen_port. The default http_listen_port is 80. Here is a full example of a config file:
# tempo.config.yaml

auth_enabled: false
server:
  http_listen_port: 80
  grpc_listen_port: 9095
distributor:
  receivers: # This configuration will listen on all ports and protocols that Tempo is capable of.
    jaeger: # the receives all come from the OpenTelemetry collector.  more configuration information can
      protocols: # be found here: https://github.com/open-telemetry/opentelemetry-collector/tree/master/receiver.
        thrift_http: #
        grpc: # For a production deployment you should only enable the receivers you need!
        thrift_binary:
        thrift_compact:
    zipkin:
    otlp:
      protocols:
        http:
        grpc:
    opencensus:
ingester:
  trace_idle_period: 10s # The length of time after a trace has not received spans to consider it complete and flush it.
  max_block_bytes: 1_000_000 # Cut the head block when it hits this size or ...
  #traces_per_block: 1_000_000
  max_block_duration: 5m #   this much time passes.
compactor:
  compaction:
    compaction_window: 1h # Blocks in this time window will be compacted together.
    max_compaction_objects: 1000000 # Maximum size of compacted blocks.
    block_retention: 1h
    compacted_block_retention: 10m
storage:
  trace:
    backend: local # Backend configuration to use.
    wal:
      path: /tmp/tempo/wal # Where to store the the wal locally.
      #bloom_filter_false_positive: .05 # Bloom filter false positive rate.  Lower values create larger filters but fewer false positives.
      #index_downsample: 10             # Number of traces per index record.
    local:
      path: /tmp/tempo/blocks
    pool:
      max_workers: 100 # The worker pool mainly drives querying, but is also used for polling the blocklist.
      queue_depth: 10000
Configure Tracetest to Use Tempo as a Trace Data Store
Configure Tracetest to be aware that it has to fetch trace data from Tempo.
Tracetest uses Tempo's gRPC endpoint on port 9095 to fetch trace data. Alternatively, you can use Tempo's HTTP endpoint and default port 80.
Need help configuring the OpenTelemetry Collector so send trace data from your application to Jaeger? Read more in the reference page here.
Connect Tracetest to Tempo with the Web UI
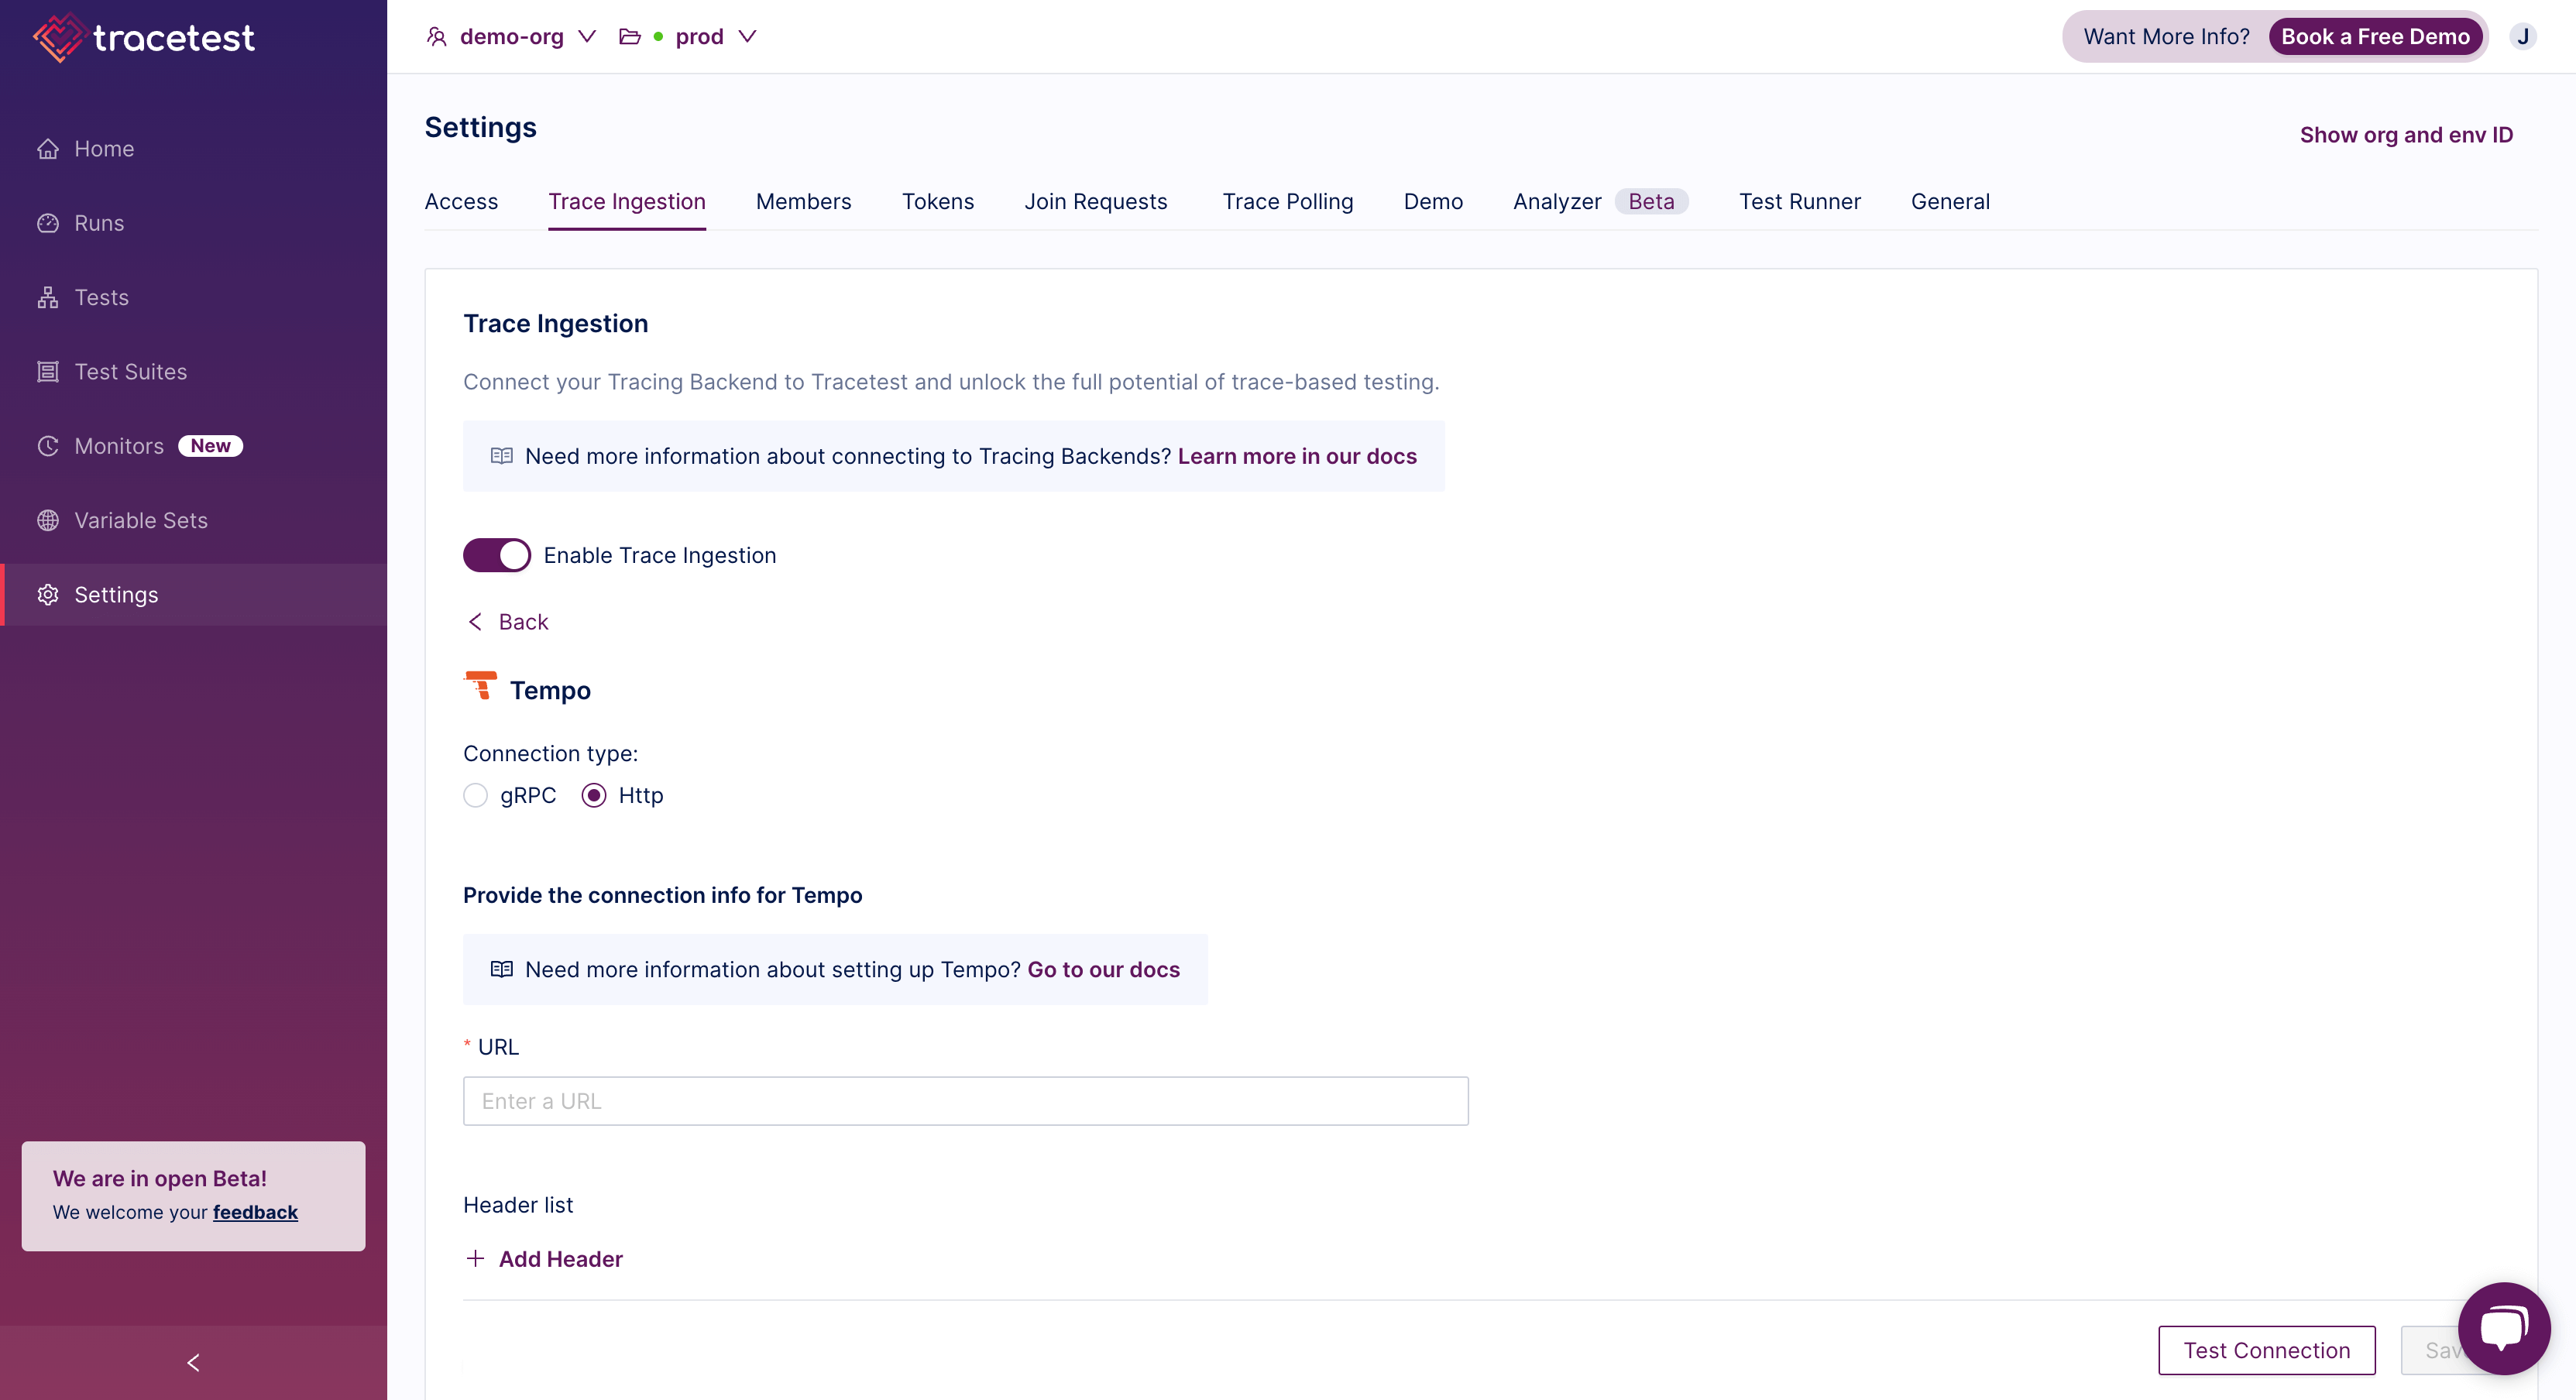
In the Web UI, (1) open Settings, and, on the (2) Trace Ingestion tab, (3) select Tempo. Then, select either gRPC or HTTP.
If you are using Docker and the gRPC endpoint like in the screenshot below, use the service name as the hostname with port 9095 like this:
tempo:9095

If you are using Docker and the HTTP URL like in the screenshot below, use the service name as the hostname with port 80 or no specified port like this:
http://tempo
Connect Tracetest to Tempo with the CLI
Or, if you prefer using the CLI, you can use this file config.
For gRPC:
type: DataStore
spec:
  name: Grafana Tempo
  type: tempo
  default: true
  tempo:
    type: grpc
    grpc:
      endpoint: tempo:9095
      tls:
        insecure: true
For HTTP:
type: DataStore
spec:
  name: Grafana Tempo
  type: tempo
  default: true
  tempo:
    type: http
    http:
      url: http://tempo
      tls:
        insecure: true
Proceed to run this command in the terminal, and specify the file above.
tracetest apply datastore -f my/data-store/file/location.yaml
To learn more, read the recipe on running a sample app with Tempo and Tracetest.