Welcome to Tracetest Docs! 👋
Tracetest is a trace-based testing tool for integration and end-to-end testing using OpenTelemetry traces. Verify end-to-end transactions and side-effects across microservices & event-driven apps by using trace data as test specs.
Why Tracetest?
You can:
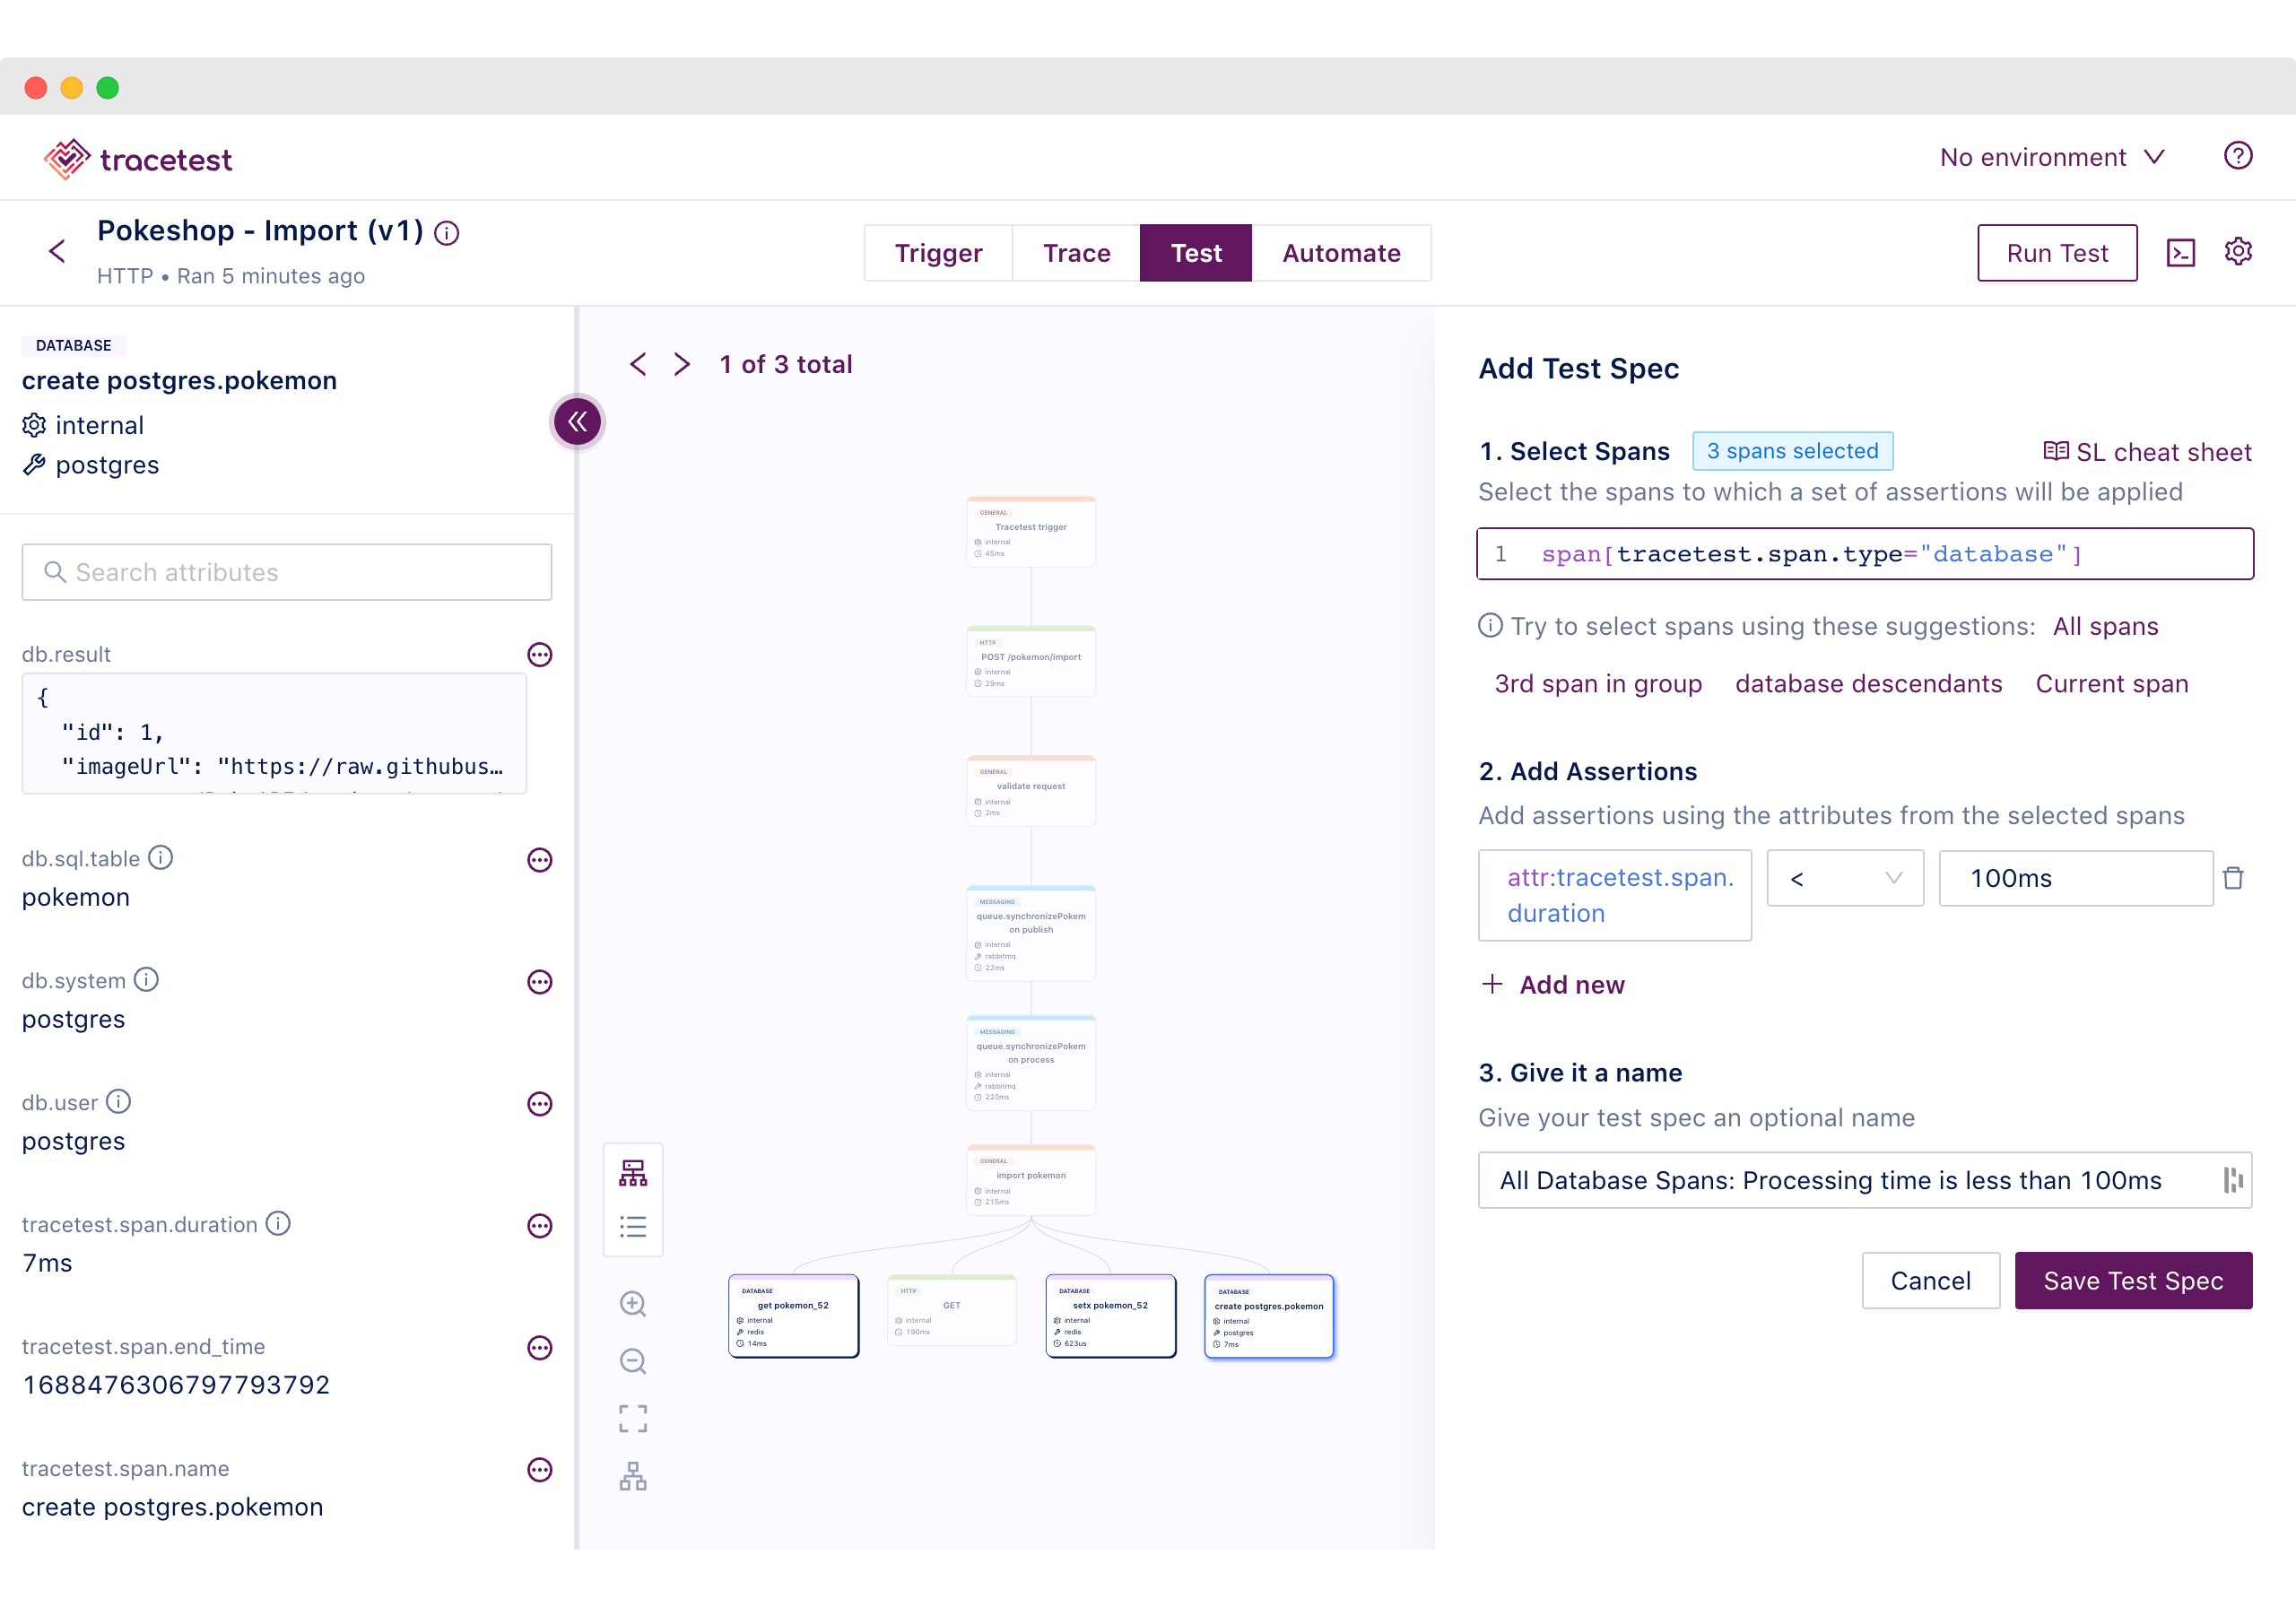
- Assert against both the response and trace data at every point of a request transaction.
- Assert on the timing of trace spans.
- Eg. A database span executes within
100ms.
- Eg. A database span executes within
- Wildcard assertions across common types of activities.
- Eg. All gRPC return codes should be
0. - Eg. All database calls should happen in less than
100ms.
- Eg. All gRPC return codes should be
- Assert against side-effects in your distributed system.
- Eg. Message queues, async API calls, external APIs, etc.
- Integrate with your existing distributed tracing solution.
- Define multiple test triggers:
- HTTP requests
- gRPC requests
- Trace IDs
- and many more...
- Save and run tests manually and via CI build jobs.
- Verify and analyze the quality of your OpenTelemetry instrumentation to enforce rules and standards.
- Test long-running processes.
- Write detailed trace-based tests as:
- End-to-end tests
- Integration tests
- Build tests in minutes.
Visually - Build tests in the Web UI
Programmatically - Build tests in YAML
Getting Started
Tracetest is a cloud-native application, designed to run in the cloud. Get started in three ways.
Cloud-based Managed Tracetest (Free to get started!)
The easiest and most reliable way to test microservices and distributed apps with OpenTelemetry distributed traces is signing up for free at app.tracetest.io. After creating an account, getting started is as easy as installing the Tracetest Agent.
Enterprise Self-hosted Tracetest (Free trial, no credit card required)
Get the same experience as with the Cloud-based Managed Tracetest but self-hosted in your own infrastructure. Request a license key or book a call to get a trial.
Hobby Self-hosted Open-source Tracetest Core
Deploy a hobby self-hosted instance of Tracetest Core as a Docker container. It's not suitable for production, but a great way to start using Tracetest Core in local environments.
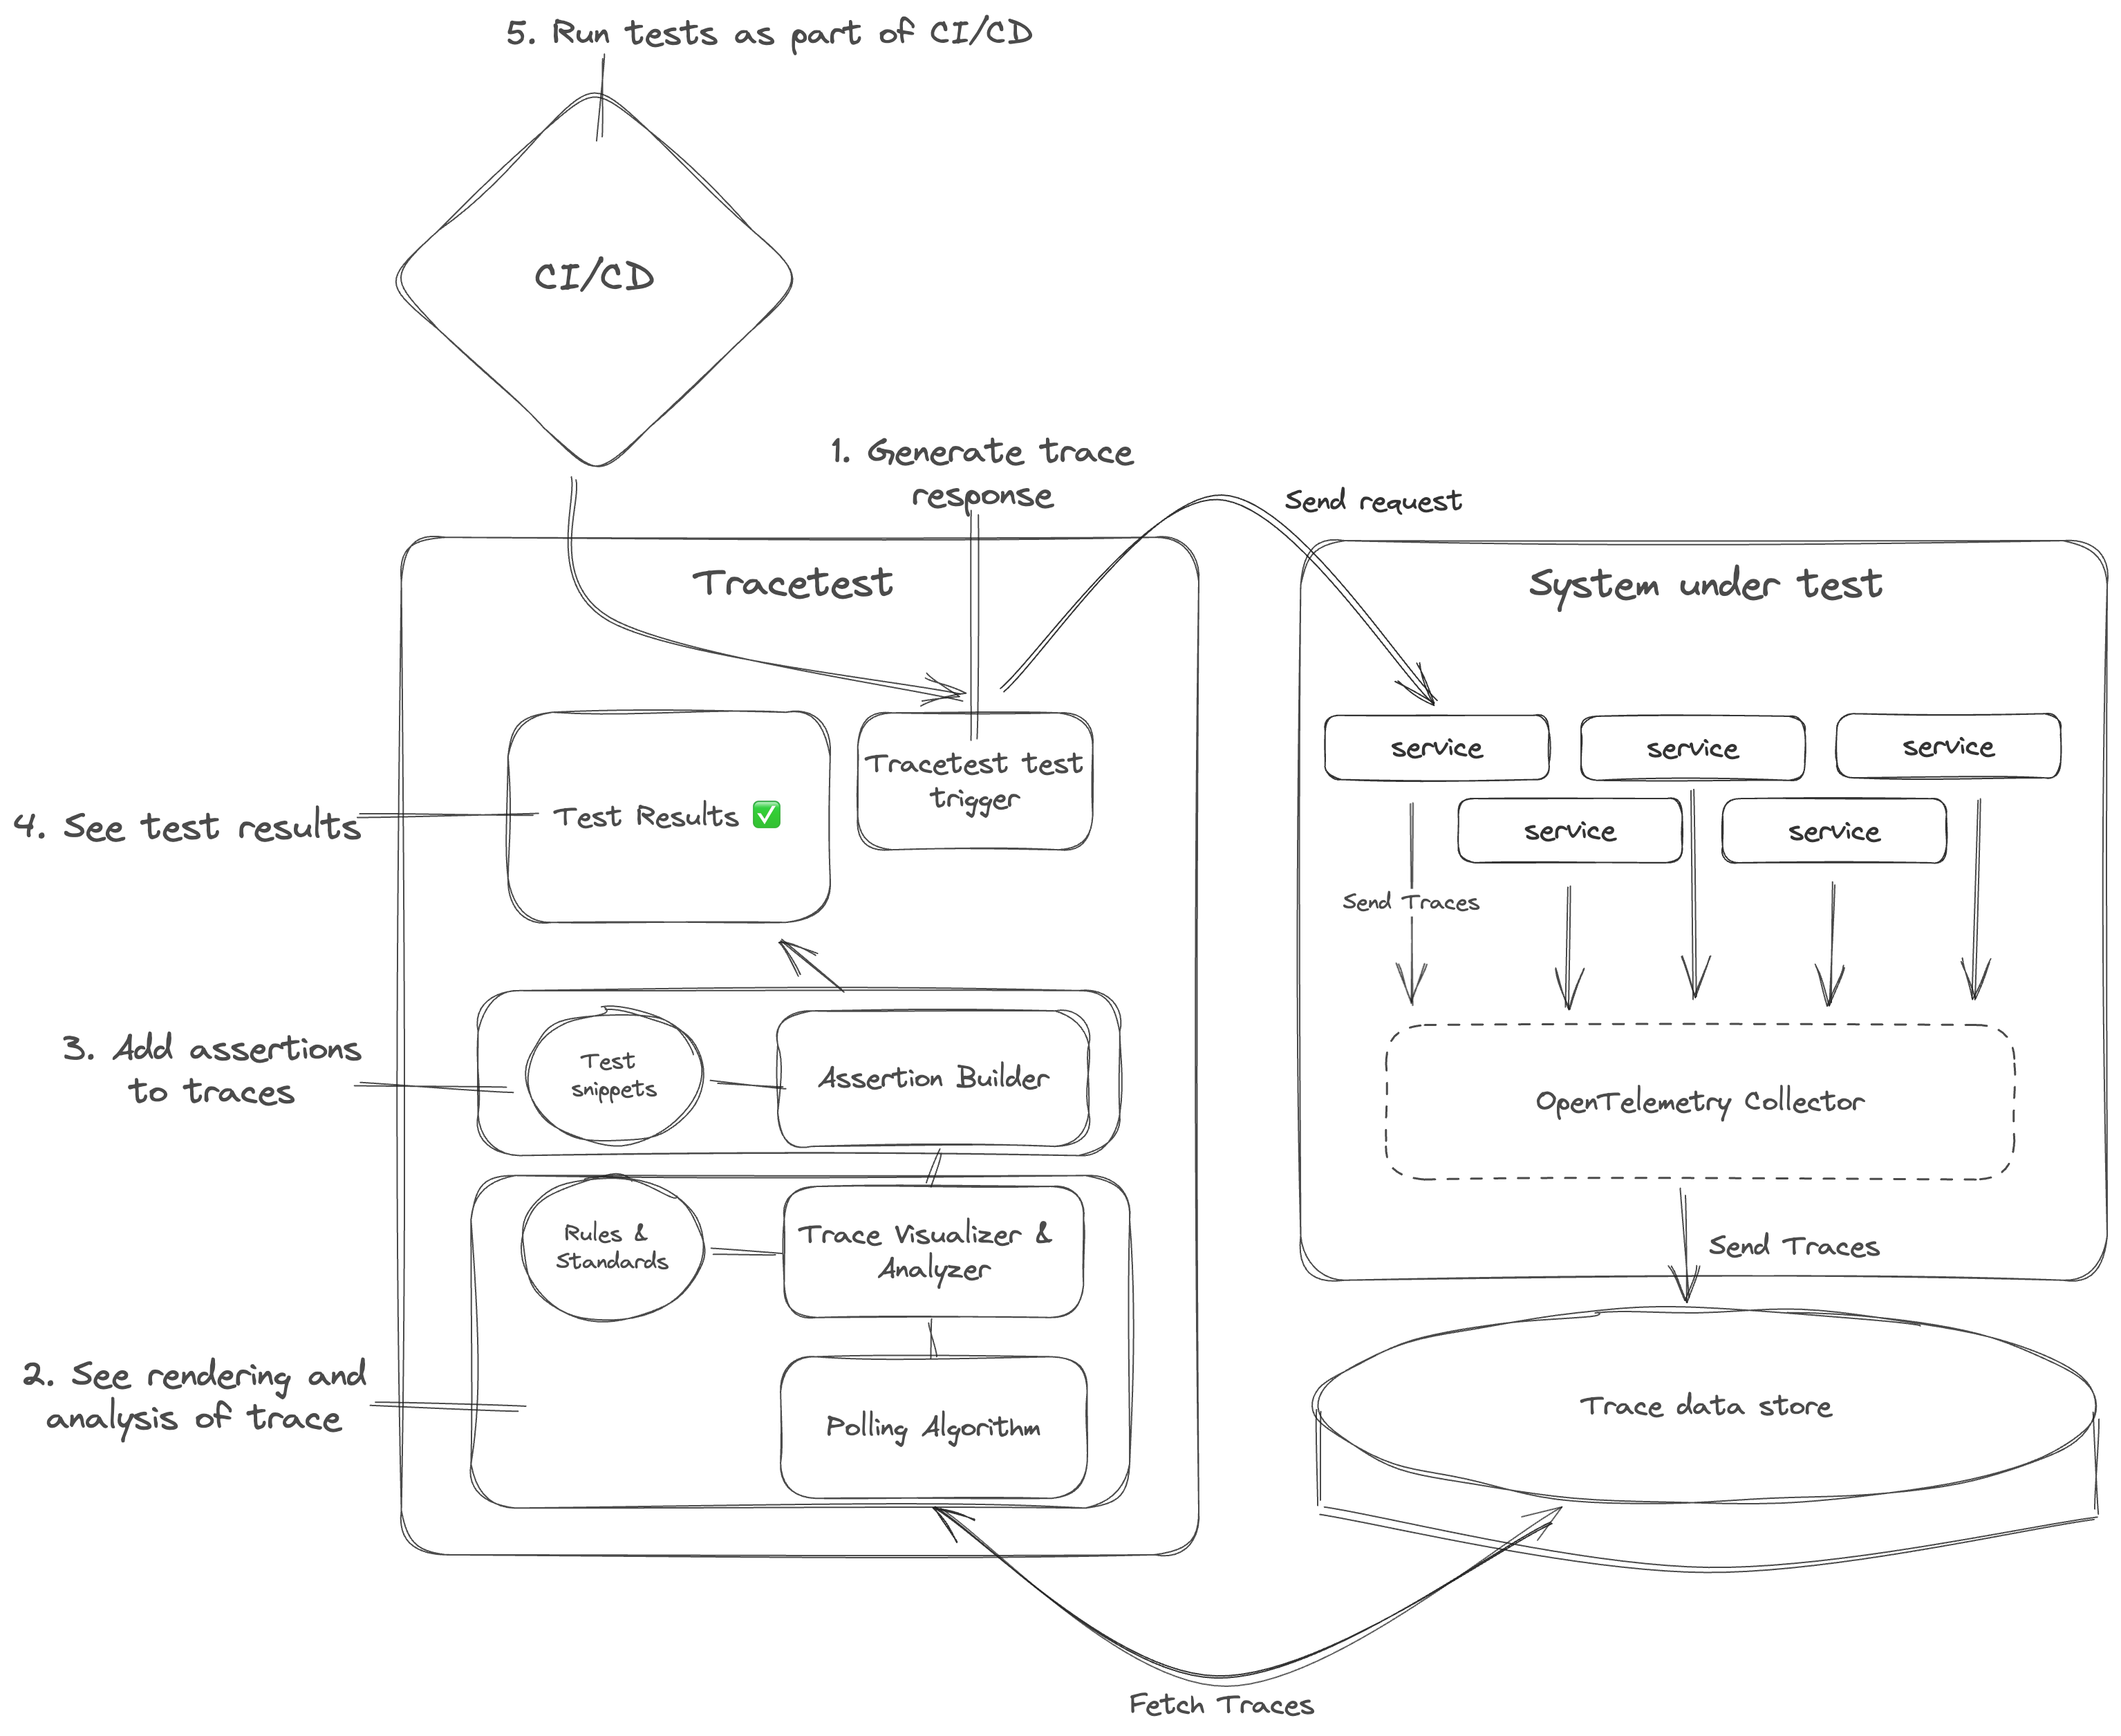
Architecture
Understand how Tracetest works.
- Trigger a test and generate a trace response.
- Fetch traces to render and analyze them.
- Add assertions to traces.
- See test results.
- Run tests as part of CI/CD pipelines.
Who uses Tracetest?
Our users are typically developers or QA engineers building distributed systems with microservices using back-end languages like Go, Rust, Node.js and Python.
What makes Tracetest special?
Tracetest can be compared with Cypress or Selenium; however Tracetest is fundamentally different.
Cypress and Selenium are constrained by using the browser for testing. Tracetest bypasses this entirely by using your existing OpenTelemetry instrumentation and trace data to run tests and assertions against traces in every step of a request transaction.