OpenTelemetry Demo and Lightstep
Tracetest is a testing tool based on OpenTelemetry that allows you to test your distributed application. It allows you to use data from distributed traces generated by OpenTelemetry to validate and assert if your application has the desired behavior defined by your test definitions.
Lightstep is a distributed tracing solution created by the founders of the OpenTelemetry (and OpenTracing) projects. It provides integrated distributed tracing, logs and metrics solution and fully supports OpenTelemetry standards.
OpenTelemetry Demo v0.3.4-alpha with Lightstep, OpenTelemetry and Tracetest
This is a simple sample app on how to configure the OpenTelemetry Demo v0.3.4-alpha to use Tracetest for enhancing your E2E and integration tests with trace-based testing and Lightstep as a trace data store.
Prerequisites
Tracetest Account:
- Sign up to
app.tracetest.ioor follow the get started docs. - Have access to the environment's agent API key.
Docker: Have Docker and Docker Compose installed on your machine.
Run This Quckstart Example
The example below is provided as part of the Tracetest project. You can download and run the example by following these steps:
Clone the Tracetest project and go to the example folder:
git clone https://github.com/kubeshop/tracetest
cd tracetest/examples/tracetest-lightstep
Follow these instructions to run the quick start:
- Copy the
.env.templatefile to.env. - Fill out the TRACETEST_TOKEN and ENVIRONMENT_ID details by editing your
.envfile. - Fill out the LIGHTSTEP_ACCESS_TOKEN details by editing your
.envfile. - Run
docker compose run tracetest-run. - Follow the links in the output to view the test results.
Follow the sections below for a detailed breakdown of what the example you just ran did and how it works.
Project Structure
The project is built with Docker Compose. It contains two distinct docker-compose.yaml files.
1. OpenTelemetry Demo
The docker-compose.yaml file and .env file in the root directory are for the OpenTelemetry Demo.
Docker Compose Network
All services in the docker-compose.yaml are on the same network and will be reachable by hostname from within other services. E.g. tracetest-agent:4317 in the collector.config.yaml will map to the tracetest-agent service, where the port 4317 is the port where Tracetest accepts traces.
OpenTelemetry Demo
The OpenDelemetry Demo is a sample microservice-based app with the purpose to demo how to correctly set up OpenTelemetry distributed tracing.
Read more about the OpenTelemetry Demo here.
The docker-compose.yaml contains 12 services.
To start the OpenTelemetry Demo by itself, run this command:
docker compose build # optional if you haven't already built the images
docker compose up
This will start the OpenTelemetry Demo. Open up http://localhost:8084 to make sure it's working. But, you're not sending the traces anywhere.
Let's fix this by configuring Tracetest and OpenTelemetry Collector to forward trace data to both Lightstep and Tracetest.
How to Send Traces to Tracetest and Lightstep
The collector.config.yaml explains that. It receives traces via either grpc or http. Then, exports them to Tracetest Agent's OTLP endpoint tracetest-agent:4317 in one pipeline, and to Lightstep in another.
Make sure to add your Lightstep access token in the headers of the otlp/lightstep exporter.
receivers:
  otlp:
    protocols:
      grpc:
      http:

processors:
  batch:
    timeout: 100ms

exporters:
  # OTLP for Tracetest
  otlp/tracetest:
    endpoint: tracetest-agent:4317
    tls:
      insecure: true
  # OTLP for Lightstep
  otlp/lightstep:
    endpoint: ingest.lightstep.com:443
    headers:
      "lightstep-access-token": ${env:LIGHTSTEP_ACCESS_TOKEN} # Send traces to Lightstep. Read more in docs here: https://docs.lightstep.com/otel/otel-quick-start

service:
  pipelines:
    traces/tracetest:
      receivers: [otlp]
      processors: [batch]
      exporters: [otlp/tracetest]
    traces/lightstep:
      receivers: [otlp]
      processors: [batch]
      exporters: [otlp/lightstep]
Running the Tests
The Test File
Check out the resources/test.yaml file.
# resources/test.yaml

type: Test
spec:
  id: YJmFC7hVg
  name: Otel - List Products
  description: Otel - List Products
  trigger:
    type: http
    httpRequest:
      url: http://otel-frontend:8084/api/products
      method: GET
      headers:
        - key: Content-Type
          value: application/json
  specs:
    - selector:
        span[tracetest.span.type="http" name="API HTTP GET" http.target="/api/products"
        http.method="GET"]
      assertions:
        - attr:http.status_code   =   200
        - attr:tracetest.span.duration  <  50ms
    - selector: span[tracetest.span.type="rpc" name="grpc.hipstershop.ProductCatalogService/ListProducts"]
      assertions:
        - attr:rpc.grpc.status_code = 0
    - selector:
        span[tracetest.span.type="rpc" name="hipstershop.ProductCatalogService/ListProducts"
        rpc.system="grpc" rpc.method="ListProducts" rpc.service="hipstershop.ProductCatalogService"]
      assertions:
        - attr:rpc.grpc.status_code = 0
To run the test, run this command in the terminal:
docker compose run tracetest-run
This test will fail just like the sample above due to the attr:tracetest.span.duration < 50ms assertion.
✘ Otel - List Products (http://localhost:11633/test/YJmFC7hVg/run/9/test)
	✘ span[tracetest.span.type="http" name="API HTTP GET" http.target="/api/products" http.method="GET"]
		✘ #cb68ccf586956db7
			✔ attr:http.status_code   =   200 (200)
			✘ attr:tracetest.span.duration  <  50ms (72ms) (http://localhost:11633/test/YJmFC7hVg/run/9/test?selectedAssertion=0&selectedSpan=cb68ccf586956db7)
	✔ span[tracetest.span.type="rpc" name="grpc.hipstershop.ProductCatalogService/ListProducts"]
		✔ #634f965d1b34c1fd
			✔ attr:rpc.grpc.status_code = 0 (0)
	✔ span[tracetest.span.type="rpc" name="hipstershop.ProductCatalogService/ListProducts" rpc.system="grpc" rpc.method="ListProducts" rpc.service="hipstershop.ProductCatalogService"]
		✔ #33a58e95448d8b22
			✔ attr:rpc.grpc.status_code = 0 (0)
If you edit the duration as in the Web UI example above, the test will pass!
View Trace Spans Over Time in Lightstep
To access a historical overview of all the trace spans the OpenTelemetry Demo generates, jump over to your Lightstep account.
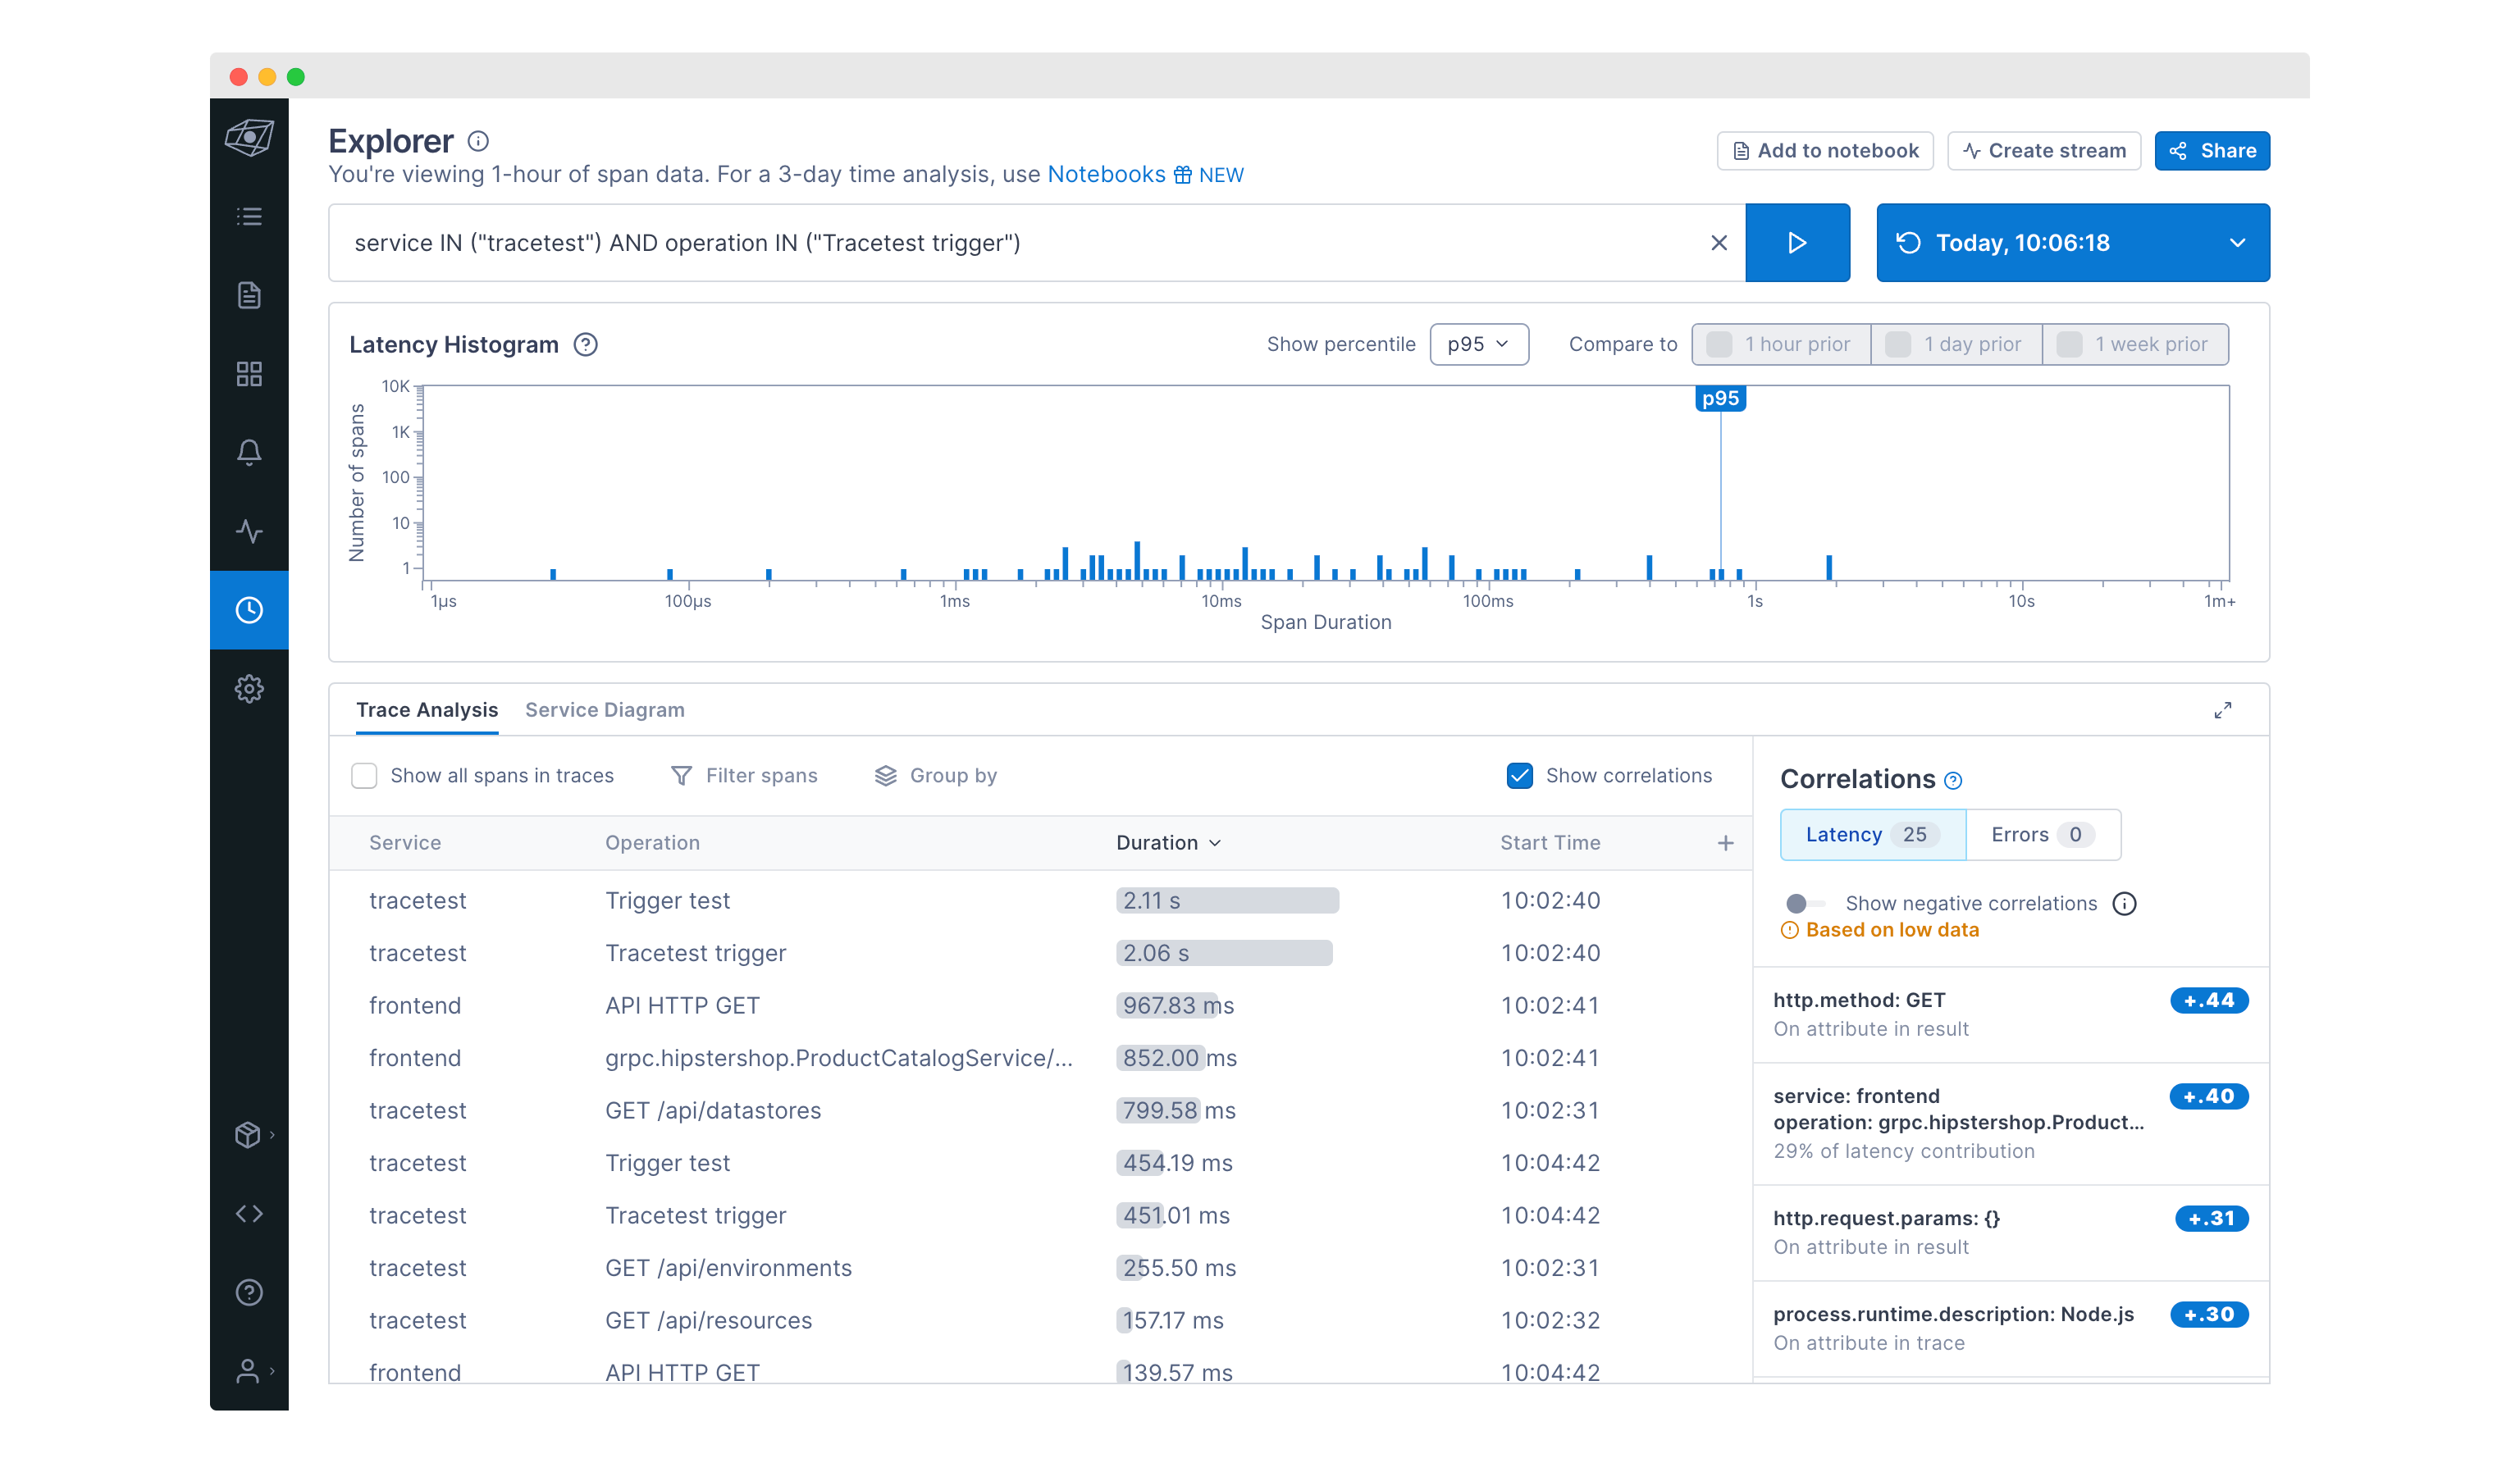
You can also drill down into a particular trace.

With Lightstep and Tracetest, you get the best of both worlds. You can run trace-based tests and automate running E2E and integration tests against real trace data. And, use Lightstep to get a historical overview of all traces your distributed application generates.
Learn More
Feel free to check out our examples in GitHub and join our Slack Community for more info!