OpenTelemetry Demo and Dynatrace
Tracetest is a testing tool based on OpenTelemetry that allows you to test your distributed application. It allows you to use data from distributed traces generated by OpenTelemetry to validate and assert if your application has the desired behavior defined by your test definitions.
Dynatrace is a unified Observability and security platform that allows you to monitor and secure your full stack on one AI-powered data platform. From infrastructure and application observability to realtime security analytics and protection, digital experience monitoring and business analytics. All underpinned by a composable app-based platform with a custom Observability-driven workflow engine.
OpenTelemetry Demo v1.3.0 with Dynatrace, OpenTelemetry and Tracetest
This is a simple sample app on how to configure the OpenTelemetry Demo v1.3.0 to use Tracetest for enhancing your E2E and integration tests with trace-based testing and Dynatrace as a trace data store.
Prerequisites
Tracetest Account:
- Sign up to
app.tracetest.ioor follow the get started docs. - Have access to the environment's agent API key.
Docker: Have Docker and Docker Compose installed on your machine.
Run This Quckstart Example
The example below is provided as part of the Tracetest project. You can download and run the example by following these steps:
Clone the Tracetest project and go to the example folder:
git clone https://github.com/kubeshop/tracetest
cd tracetest/examples/tracetest-dynatrace
Follow these instructions to run the quick start:
- Copy the
.env.templatefile to.env. - Fill out the TRACETEST_TOKEN and ENVIRONMENT_ID details by editing your
.envfile. - Fill out the DYNATRACE_SECRET details by editing your
.envfile. - Run
docker compose run tracetest-run. - Follow the links in the output to view the test results.
Follow the sections below for a detailed breakdown of what the example you just ran did and how it works.
Project Structure
The project is built with Docker Compose. It contains two distinct docker-compose.yaml files.
1. OpenTelemetry Demo
The docker-compose.yaml file and .env file in the root directory are for the OpenTelemetry Demo.
2. Tracetest
The docker-compose.yaml file, collector.config.yaml, tracetest-provision.yaml, and tracetest-config.yaml in the tracetest directory are for setting up Tracetest and the OpenTelemetry Collector.
Docker Compose Network
All services in the docker-compose.yaml are on the same network, defined by the networks section on each file, and will be reachable by hostname from within other services. E.g. tracetest-agent:4317 in the collector.config.yaml will map to the tracetest-agent service, where port 4317 is the port where Tracetest Agent accepts traces.
OpenTelemetry Demo
The OpenTelemetry Demo is a sample microservice-based app with the purpose to demo how to correctly set up OpenTelemetry distributed tracing.
Read more about the OpenTelemetry Demo here.
The docker-compose.yaml contains 14 services for the demo and 3 supporting dependent services.
To start the OpenTelemetry Demo by itself, run this command:
docker compose up
This will start the OpenTelemetry Demo. Open up http://localhost:8084 to make sure it's working. But, you're not sending the traces anywhere.
Let's fix this by configuring Tracetest and the OpenTelemetry Collector to forward trace data to both Dynatrace and Tracetest.
Sending Traces to Tracetest and Dynatrace
The collector.config.yaml explains that. It receives traces via either grpc or http. Then, exports them to Tracetest Agent's OTLP endpoint tracetest-agent:4317 in one pipeline, and to Dynatrace in another.
Make sure to add your Dynatrace API Key to the otlp exporter (needs the openTelemetryTrace.ingest permission).
receivers:
  otlp:
    protocols:
      http:
      grpc:
  hostmetrics:
    collection_interval: 10s
    scrapers:
      paging:
        metrics:
          system.paging.utilization:
            enabled: true
      cpu:
        metrics:
          system.cpu.utilization:
            enabled: true
      disk:
      filesystem:
        metrics:
          system.filesystem.utilization:
            enabled: true
      load:
      memory:
      network:
      processes:
  # The prometheus receiver scrapes metrics needed for the OpenTelemetry Collector Dashboard.
  prometheus:
    config:
      scrape_configs:
      - job_name: 'otelcol'
        scrape_interval: 10s
        static_configs:
        - targets: ['0.0.0.0:8888']

processors:
  batch: # this configuration is needed to guarantee that the data is sent correctly to Dynatrace
    send_batch_max_size: 100
    send_batch_size: 10
    timeout: 10s

exporters:
  # OTLP for Tracetest
  otlp/tracetest:
    endpoint: tracetest-agent:4317
    tls:
      insecure: true
  # OTLP for Dynatrace
  otlphttp/dynatrace:
    endpoint: https://abc12345.live.dynatrace.com/api/v2/otlp
    headers:
      Authorization: "Api-Token ${DYNATRACE_SECRET}"  # Requires "openTelemetryTrace.ingest" permission

service:
  pipelines:
    traces/tracetest:
      receivers: [otlp]
      processors: [batch]
      exporters: [otlp/tracetest]
    traces/dynatrace:
      receivers: [otlp]
      processors: [batch]
      exporters: [otlphttp/dynatrace]
    metrics:
      receivers: [hostmetrics, otlp]
      processors: [batch]
      exporters: [otlphttp/dynatrace]
Running the Tests
The Test File
Check out the resources/test.yaml file.
# resources/test.yaml
type: Test
spec:
  id: JBYAfKJ4R
  name: OpenTelemetry Shop - List Products
  description: List Products available on OTel shop
  trigger:
    type: http
    httpRequest:
      url: http://frontend:8084/api/products
      method: GET
      headers:
      - key: Content-Type
        value: application/json
  specs:
  - selector: span[tracetest.span.type="general" name="Tracetest trigger"]
    assertions:
    - attr:tracetest.response.status   =   200
    - attr:tracetest.span.duration  <  10ms
  - selector: span[tracetest.span.type="rpc" name="grpc.hipstershop.ProductCatalogService/ListProducts"]
    assertions:
    - attr:rpc.grpc.status_code = 0
  - selector: span[tracetest.span.type="rpc" name="hipstershop.ProductCatalogService/ListProducts"
      rpc.system="grpc" rpc.method="ListProducts" rpc.service="hipstershop.ProductCatalogService"]
    assertions:
    - attr:rpc.grpc.status_code = 0
To run the test, run this command in the terminal:
docker compose run tracetest-run
This test will fail just like the sample above due to the attr:tracetest.span.duration < 10ms assertion.
✘ OpenTelemetry Shop - List Products (http://localhost:11633/test/JBYAfKJ4R/run/1/test) - trace id: b9db3e805490f6e1d9aff7c48100d367
	✘ span[tracetest.span.type="general" name="Tracetest trigger"]
		✘ #bf9abd7861371975
			✔ attr:tracetest.response.status   =   200 (200)
			✘ attr:tracetest.span.duration  <  10ms (1.3s) (http://localhost:11633/test/JBYAfKJ4R/run/1/test?selectedAssertion=0&selectedSpan=bf9abd7861371975)
	✔ span[tracetest.span.type="rpc" name="grpc.hipstershop.ProductCatalogService/ListProducts"]
		✔ #52a4bd4cbace9c4b
			✔ attr:rpc.grpc.status_code = 0 (0)
	✔ span[tracetest.span.type="rpc" name="hipstershop.ProductCatalogService/ListProducts" rpc.system="grpc" rpc.method="ListProducts" rpc.service="hipstershop.ProductCatalogService"]
		✔ #533d2199d7e26437
			✔ attr:rpc.grpc.status_code = 0 (0)

	✘ Required gates
		✔ analyzer-score
		✘ test-specs
If you edit the duration as in the Web UI example above, the test will pass!
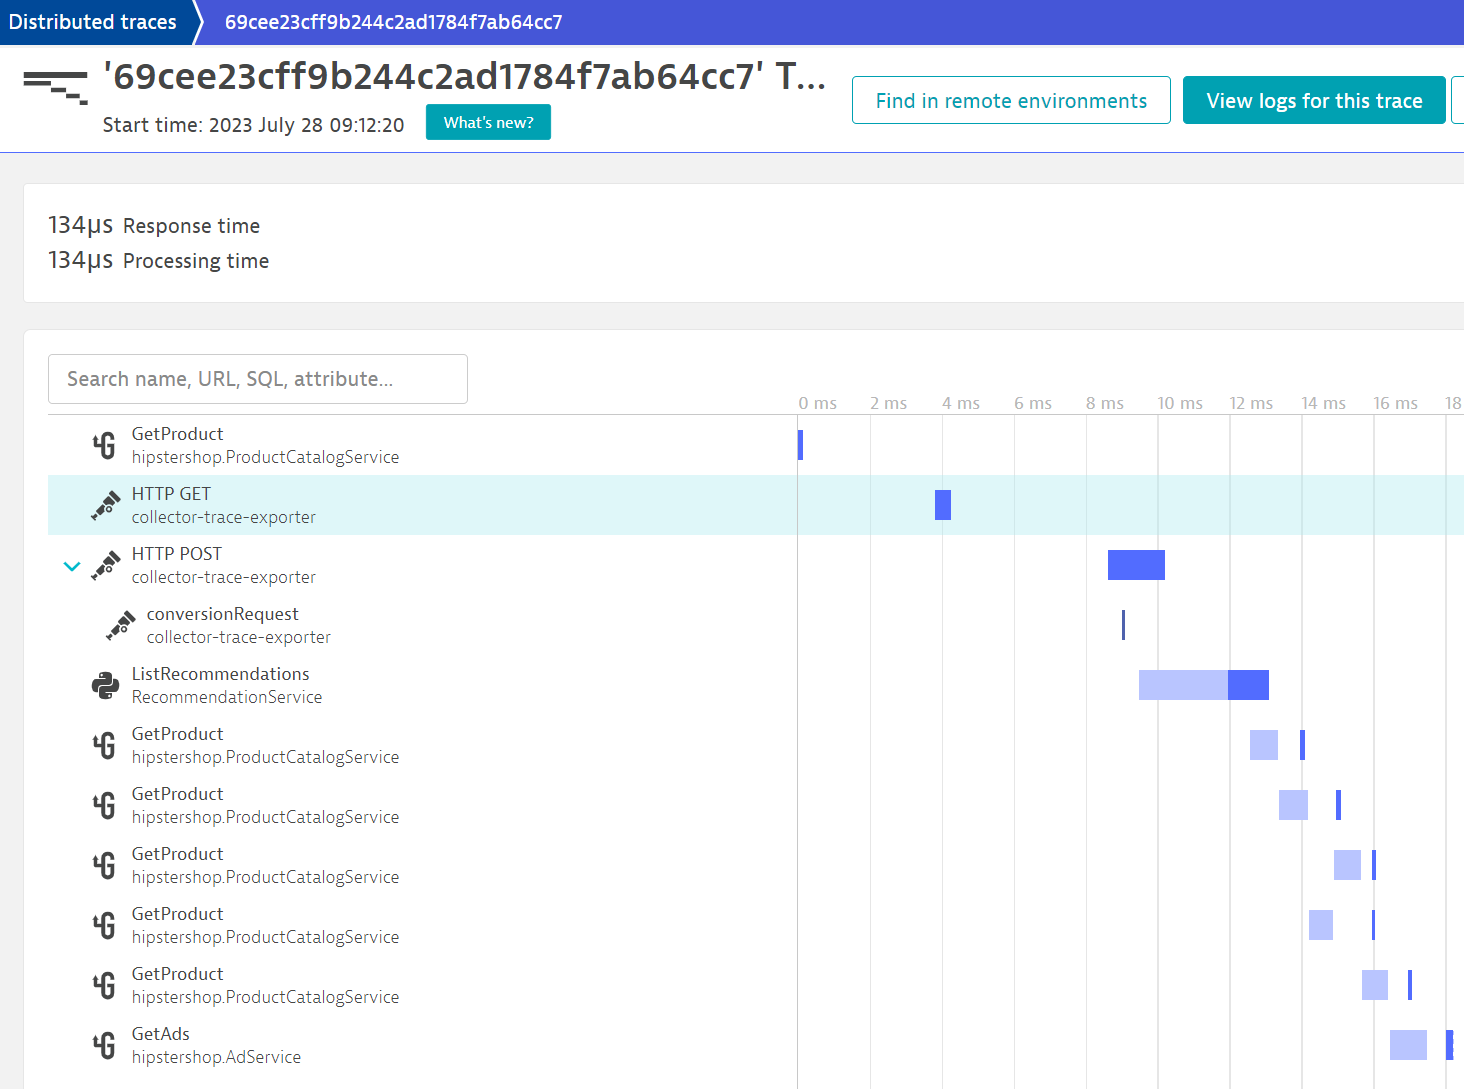
View Trace Spans Over Time in Dynatrace
All distributed traces (whether generated by OpenTelemetry or the OneAgent) are available in Dynatrace in the distributed traces app.
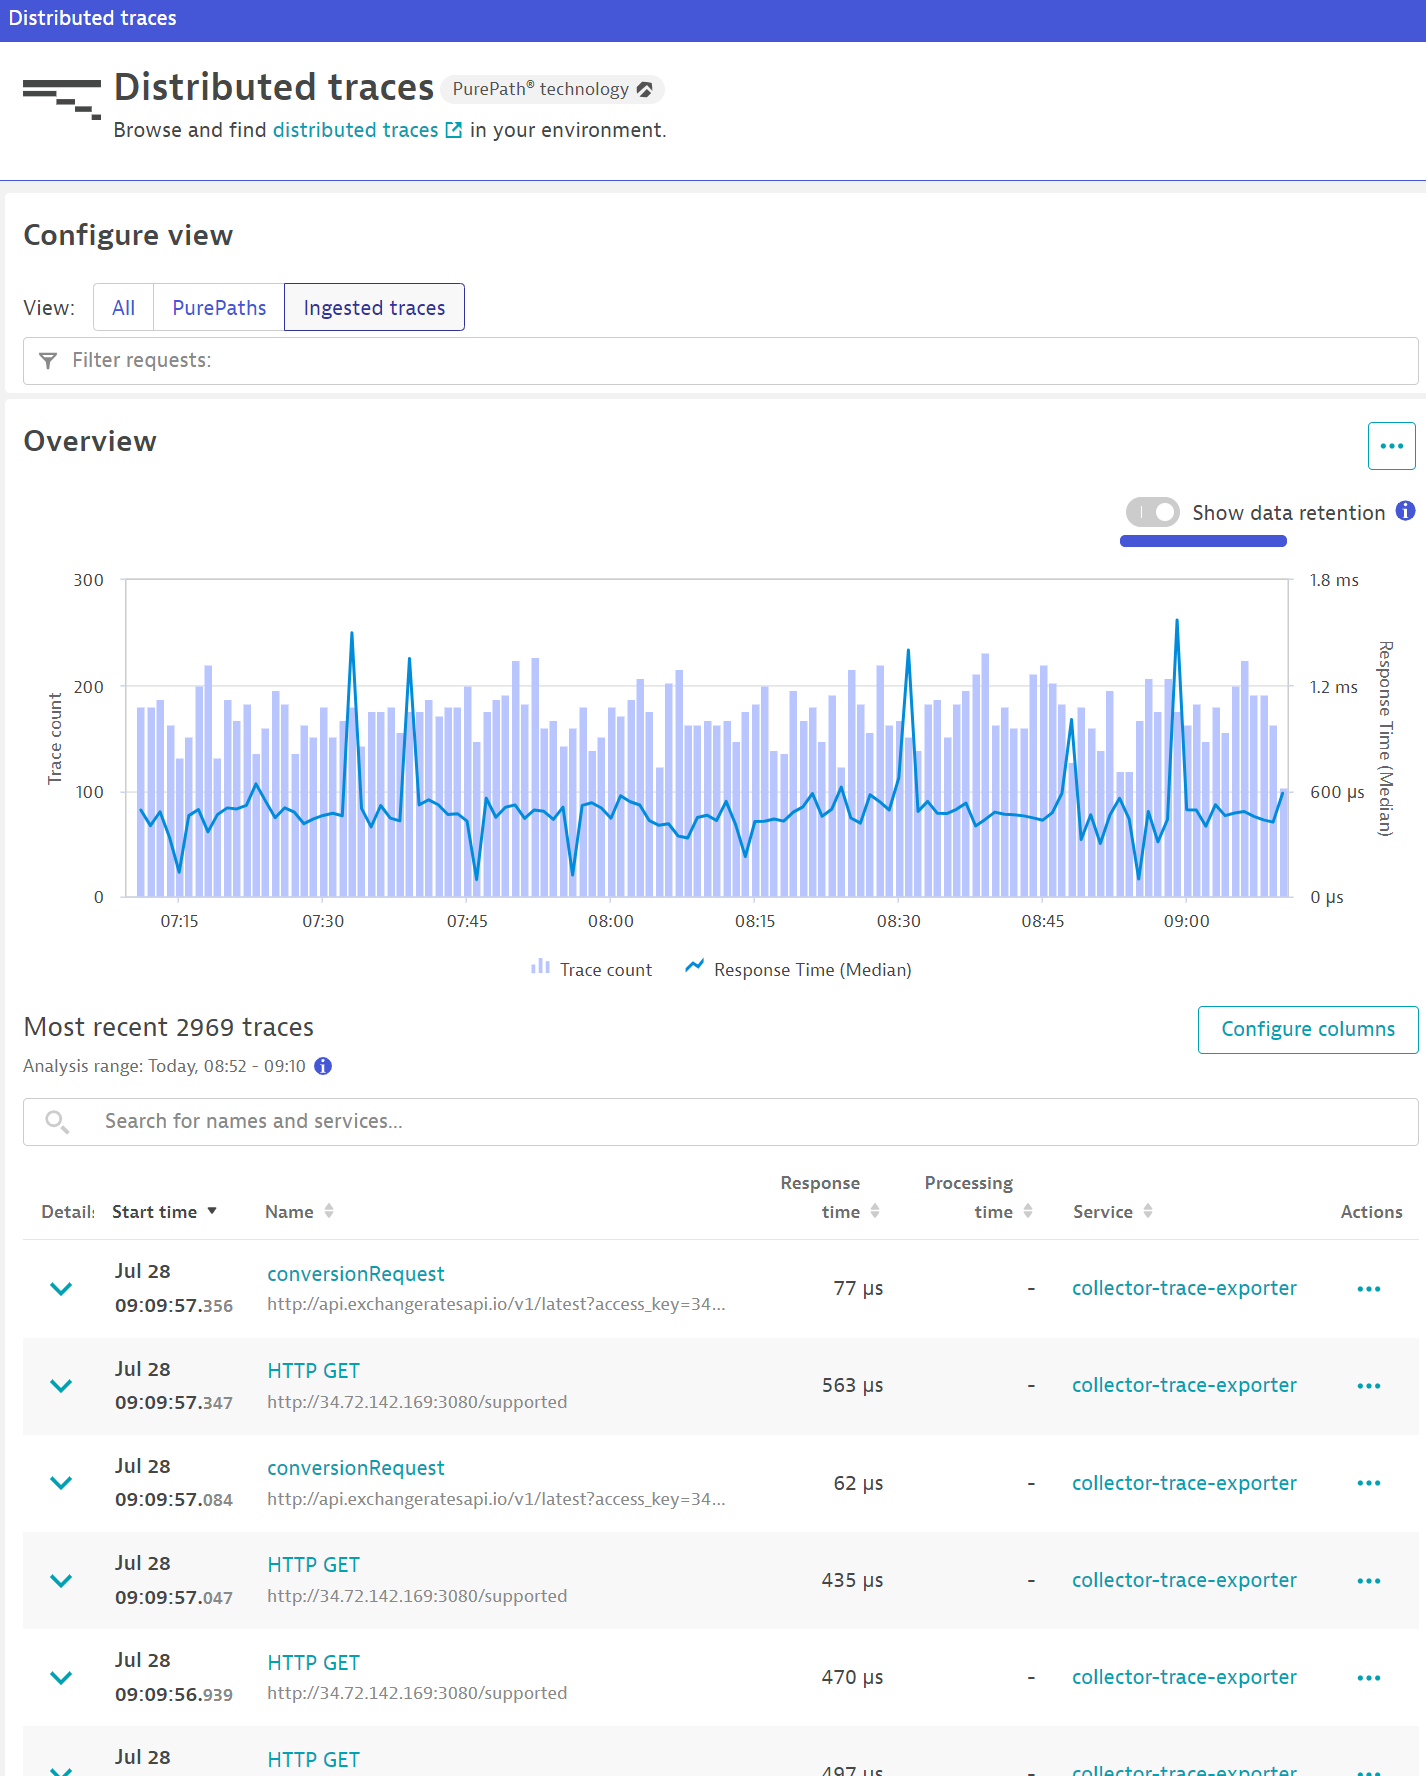
You can also drill down into a particular trace.
The combination of Dynatrace and Tracetest is extremely powerful. Ingest your traces to Dynatrace for long term storage at planetary scale and encourage your developers to incorporate trace-based testing into their workflows with Tracetest.
Learn more
Feel free to check out our examples in GitHub and join our Slack Community for more info!