Synthetic Monitoring with Trace-based API Tests
Tracetest is a synthetic monitoring and testing tool based on OpenTelemetry that allows you to test distributed apps. You can use data from distributed traces generated by OpenTelemetry to validate and assert the functionality of your apps.
Basic Node.js API with OpenTelemetry
This is a simple quick start on how to configure a Node.js app to use OpenTelemetry instrumentation with traces, and Tracetest for trace-based testing and synthetic monitoring.
To view the full guide on how to configure the Node.js app, view this recipe. The rest of this recipe focuses on synthetic monitoring.
Prerequisites
Tracetest Account:
- Sign up to
app.tracetest.ioor follow the get started docs. - Have access to the environment's agent API key.
Docker: Have Docker and Docker Compose installed on your machine.
Run This Quckstart Example
The example below is provided as part of the Tracetest project. You can download and run the example by following these steps:
Clone the Tracetest project and go to the Node.js Quickstart with Manual Instrumentation:
git clone https://github.com/kubeshop/tracetest
cd tracetest/examples/quick-start-nodejs-synthetic-monitoring
Follow these instructions to run the quick start:
- Copy the
.env.templatefile to.env. - Fill out the TRACETEST_TOKEN and ENVIRONMENT_ID details by editing your
.envfile. - Run
docker compose run tracetest-run. - Follow the links in the output to view the test results.
Follow along with the sections below for an in detail breakdown of what the example you just ran did and how it works.
Running the Node.js App and Tracetest
To start the full setup, run the following command:
docker compose run tracetest-run
This will:
- Start the Node.js app, the OpenTelemetry Collector, and send the traces to Tempo.
- Start the Tracetest Agent.
- Configure the tracing backend and create the monitor and tests in your environment.
- Run the tests.
The output of the test will look similar to this:
Configuring Tracetest
 SUCCESS  Successfully configured Tracetest CLI
Running Trace-Based Tests...
✘ RunGroup: #BakgyljIg (https://app.tracetest.io/organizations/xxx/environments/xxx/run/BakgyljIg)
 Summary: 0 passed, 1 failed, 0 pending
  ✘ Books list with availability (https://app.tracetest.io/organizations/xxx/environments/xxx/test/phAZcrT4B/run/4/test) - trace id: 27aea5374b4d0caa8cb5b986eb0b1762
	✔ span[tracetest.span.type="http" name="GET /books" http.target="/books" http.method="GET"]
		✔ #27186220b79017aa
			✔ attr:tracetest.span.duration  < 500ms (25ms)
	✔ span[tracetest.span.type="general" name="Books List"]
		✔ #48fcfad5fe4b70bb
			✔ attr:books.list.count = 3 (3)
	✔ span[tracetest.span.type="http" name="GET /availability/:bookId" http.method="GET"]
		✔ #ce6374a67450375c
			✔ attr:http.host = "availability:8080" (availability:8080)
		✔ #f470512997599d36
			✔ attr:http.host = "availability:8080" (availability:8080)
		✔ #2f9e722285ed8cdb
			✔ attr:http.host = "availability:8080" (availability:8080)
	✘ span[tracetest.span.type="general" name="Availablity check"]
		✔ #f93af70cc7f4383b
			✔ attr:isAvailable = "true" (true)
		✔ #89095118143dd135
			✔ attr:isAvailable = "true" (true)
		✘ #55b3371b8a9e8c59
			✘ attr:isAvailable = "true" (false) (https://app.tracetest.io/organizations/xxx/environments/xxx/test/phAZcrT4B/run/4/test?selectedAssertion=3&selectedSpan=55b3371b8a9e8c59)

	✘ Required gates
		✘ test-specs
Follow the links in the output to view the run group and the test result on Tracetest.
The Docker file exposes the underlying Node.js app at http://localhost:8080/.
Open Tracetest and start creating tests using this environment! Make sure to use the http://app:8080/ URL in your test creation, because your Node.js app and the Tracetest agent are in the same network. This simple Node.js application only supports a GET operation against http://app:8080/ and should return the string 'Hello World'.
Run Synthetic Monitoring
The monitor will be automatically applied when running this example. You can find the Tracetest Monitor Definition and apply it directly yourself using the CLI.
tracetest apply monitor -f ./resources/monitor.yaml
This will start running the ./resources/monitor.yaml test every minute.
With the Web UI follow these steps to create a monitor.
- Select
Monitorsin the Tracetest sidebar. - Create a Monitor. Select a schedule and toggle the enable monitor switch.
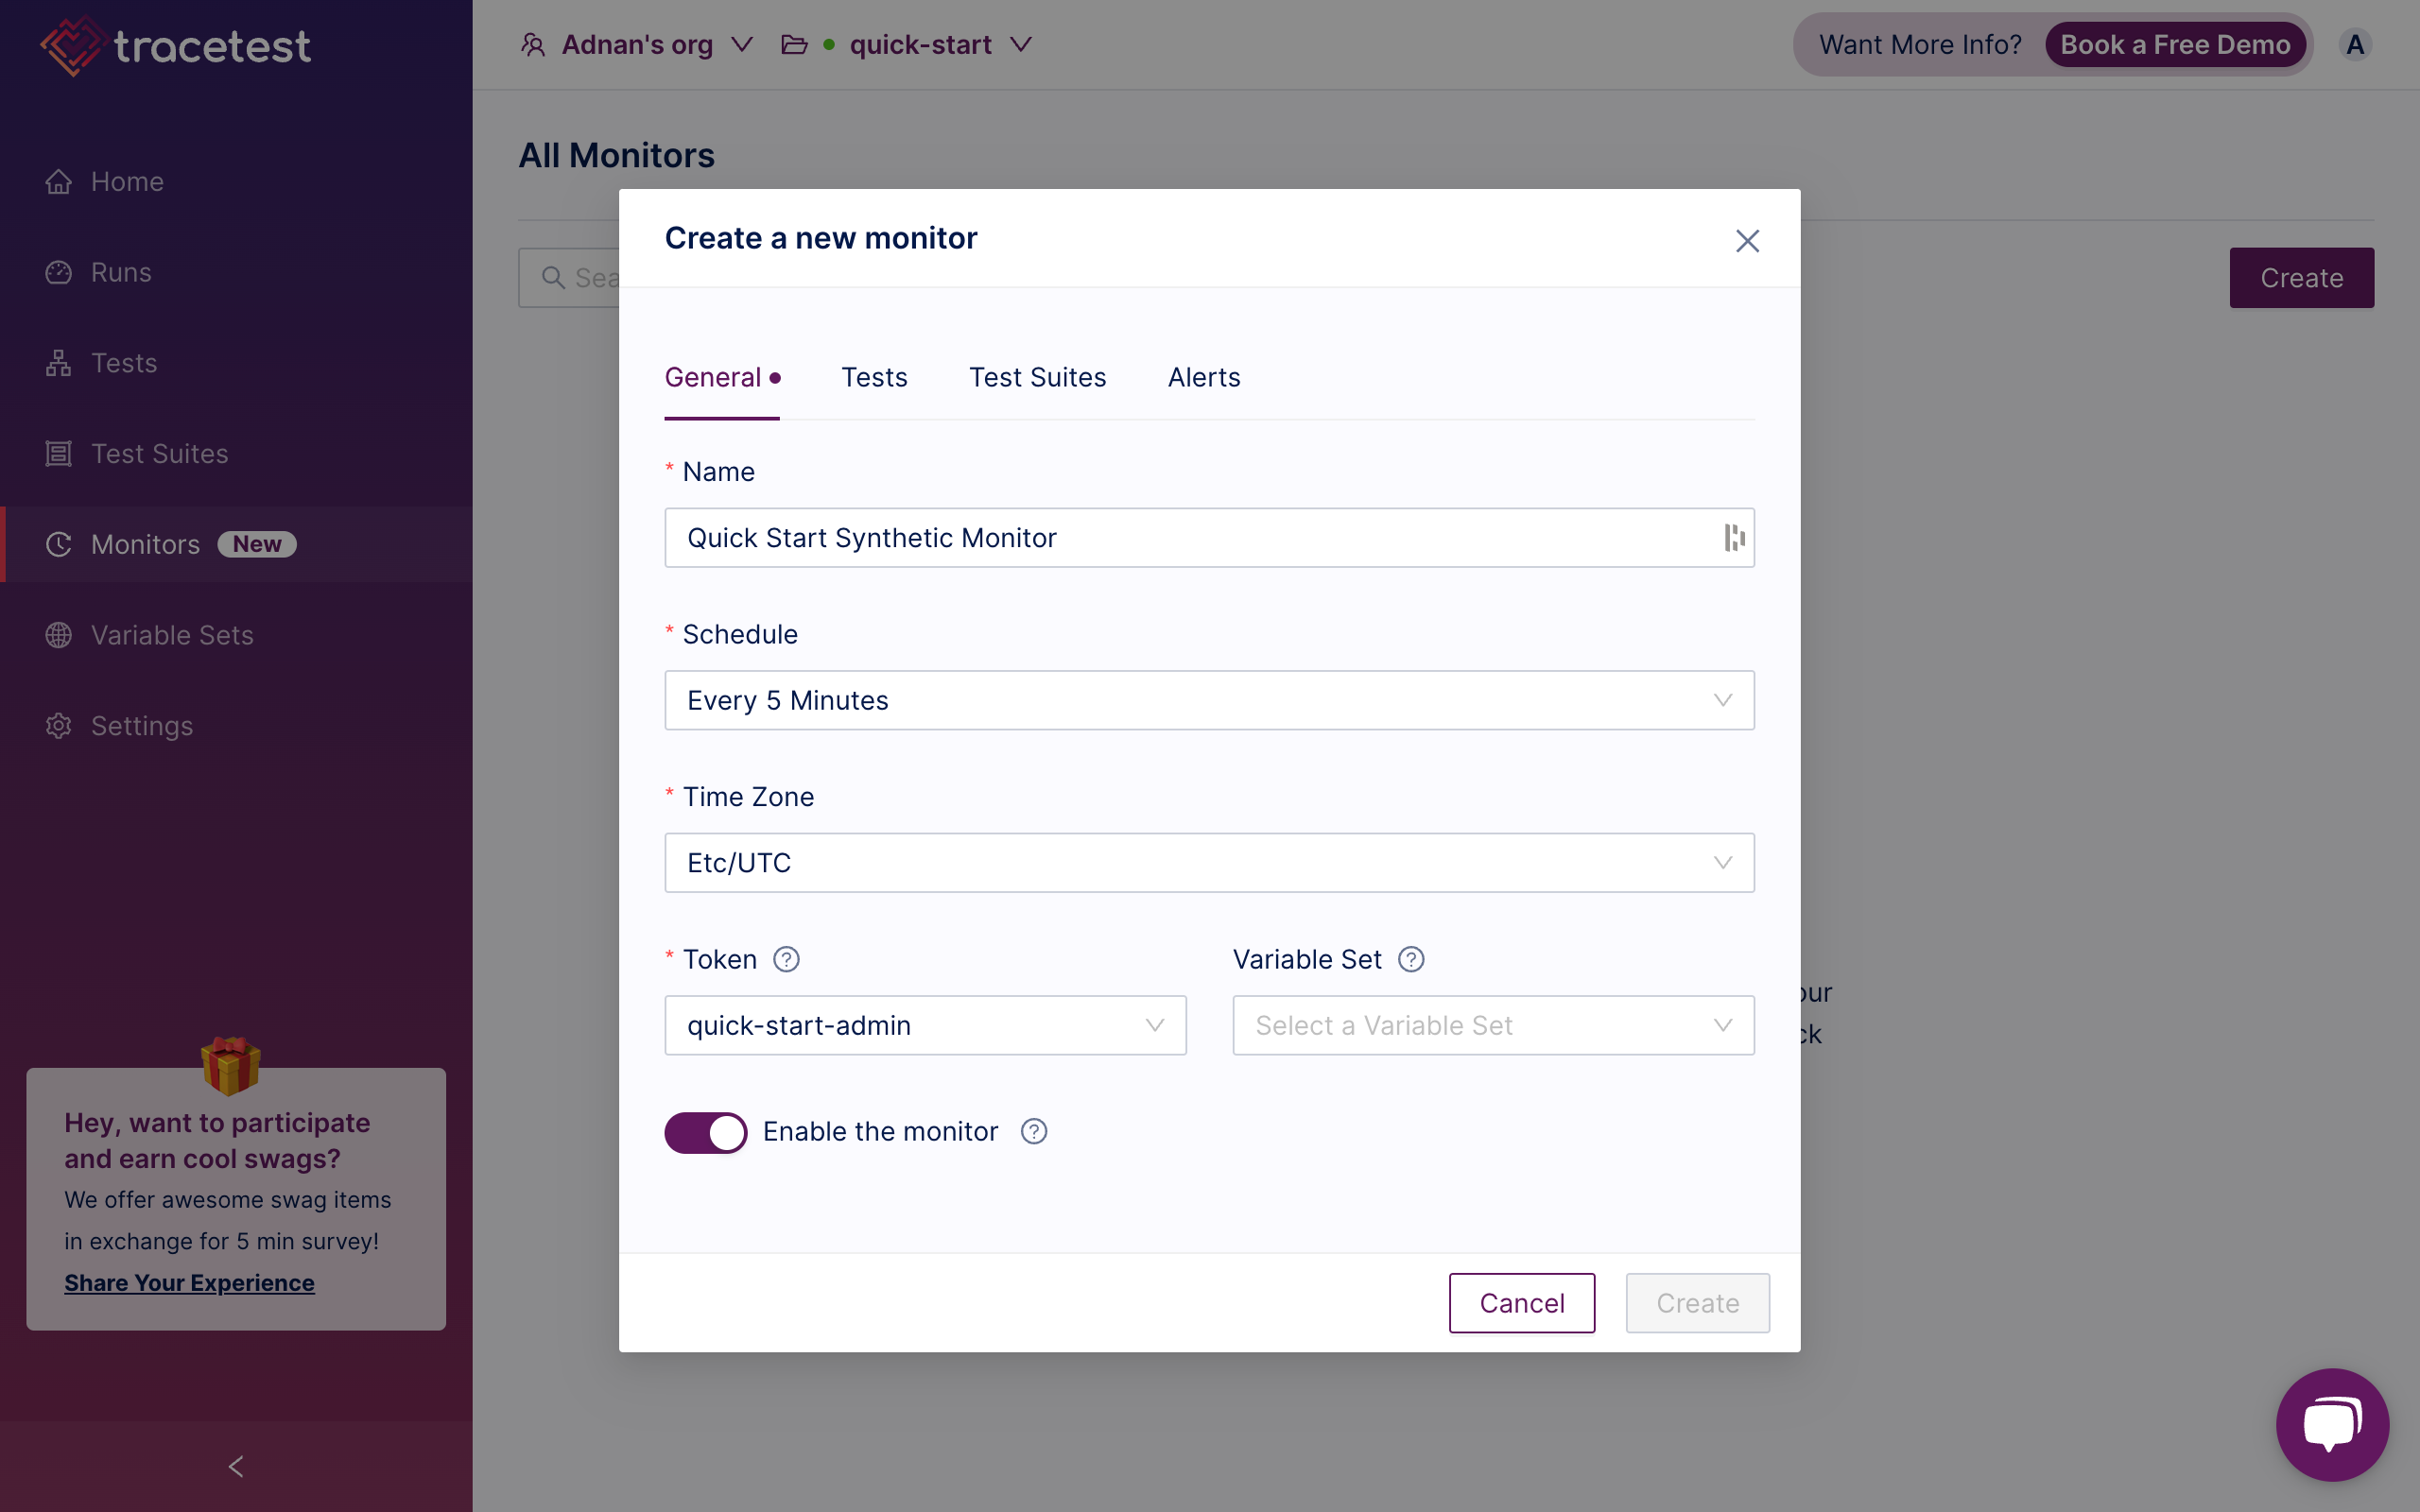
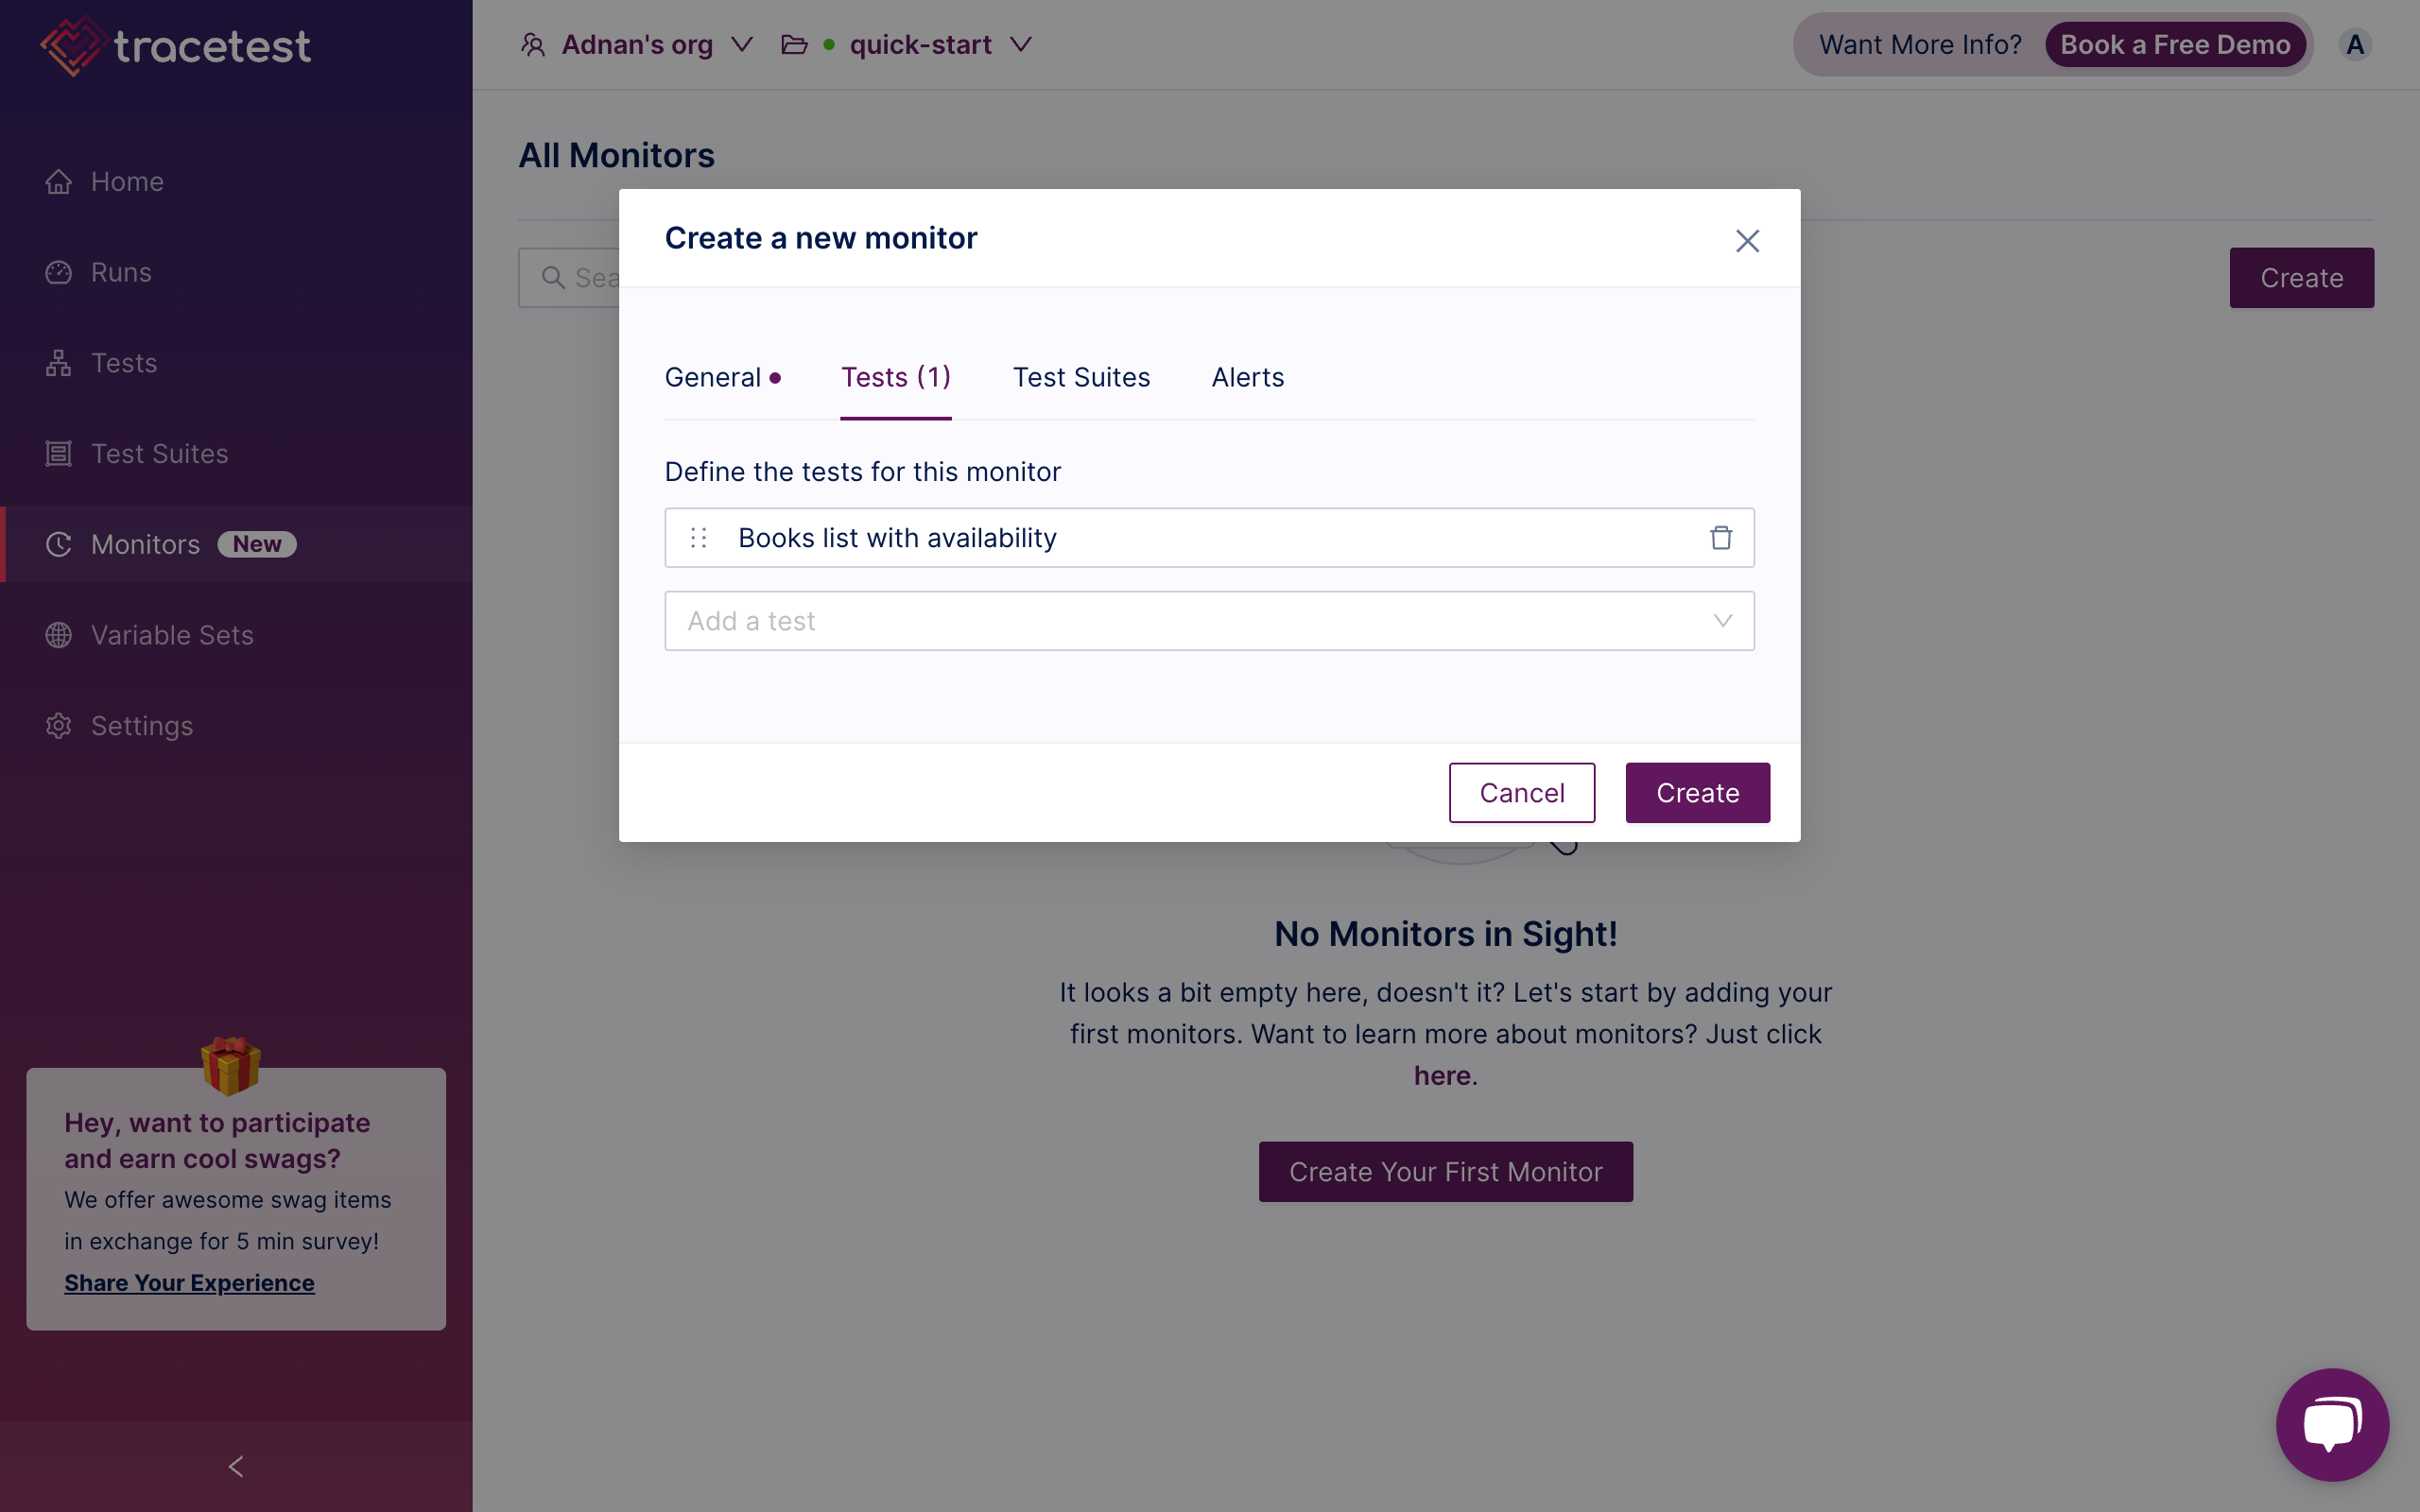
- Select the test you want to add to the Monitor.
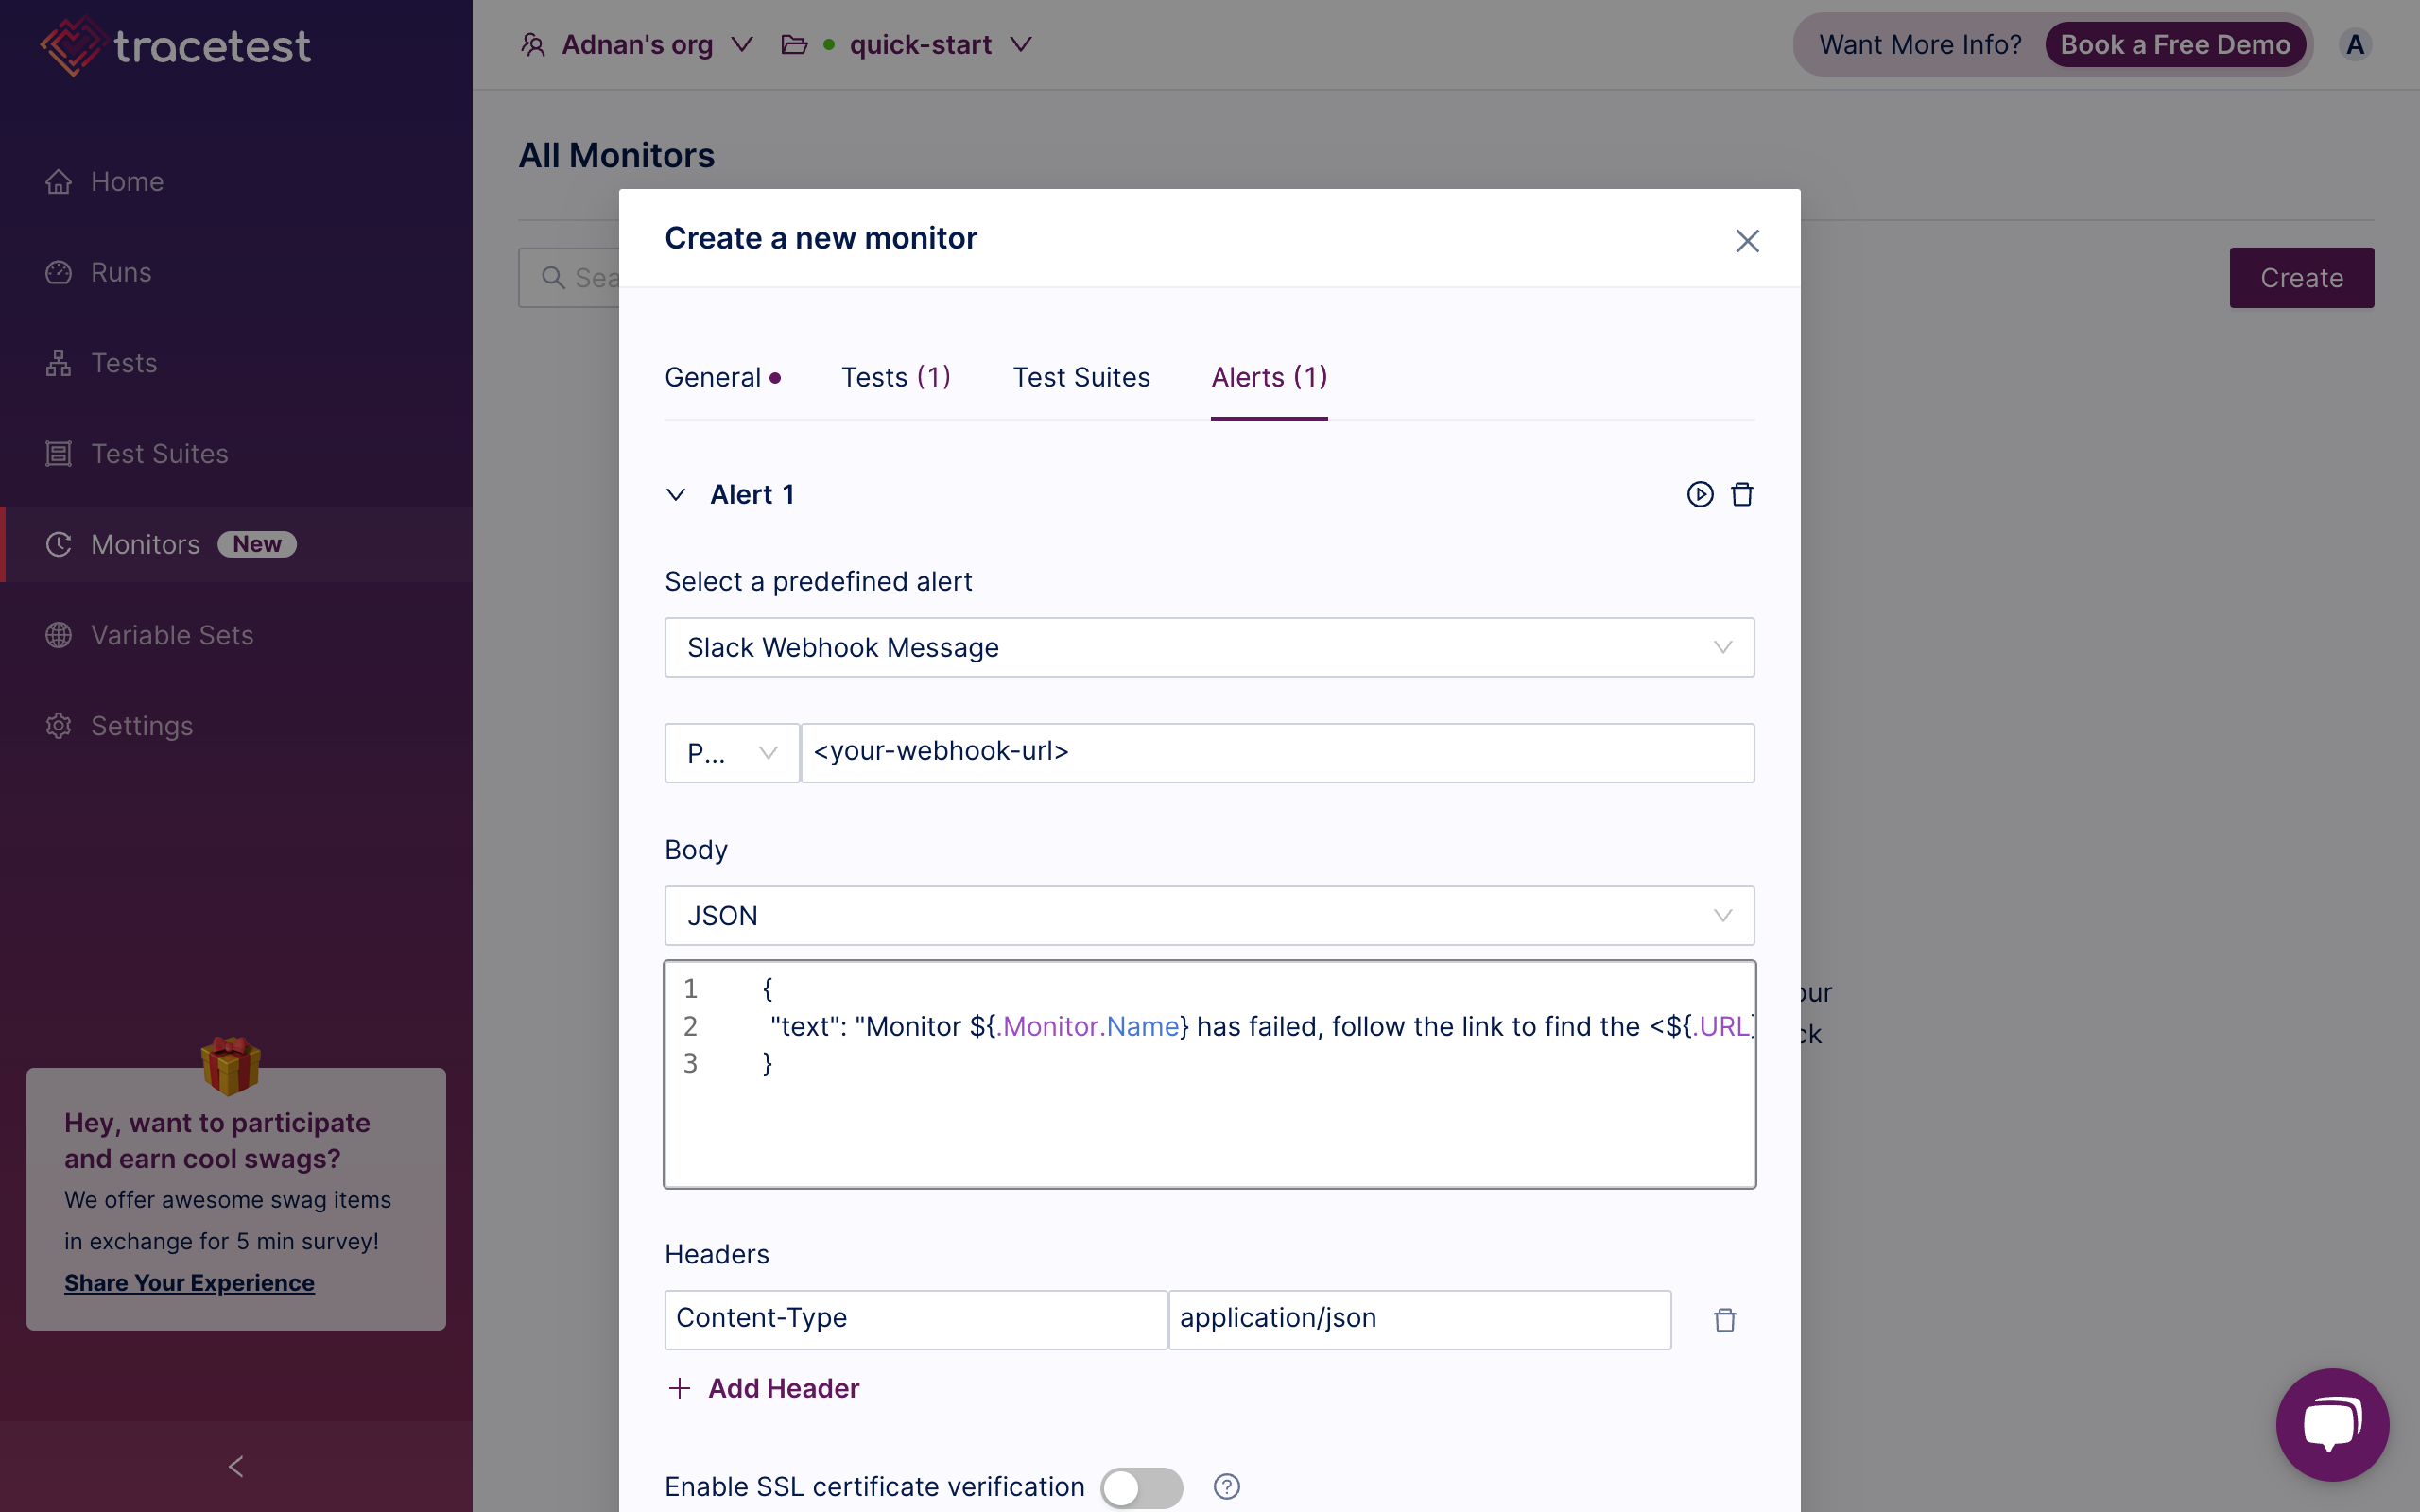
- Select the webhook you want to notify.
- Click
Createand you will see the Monitor run.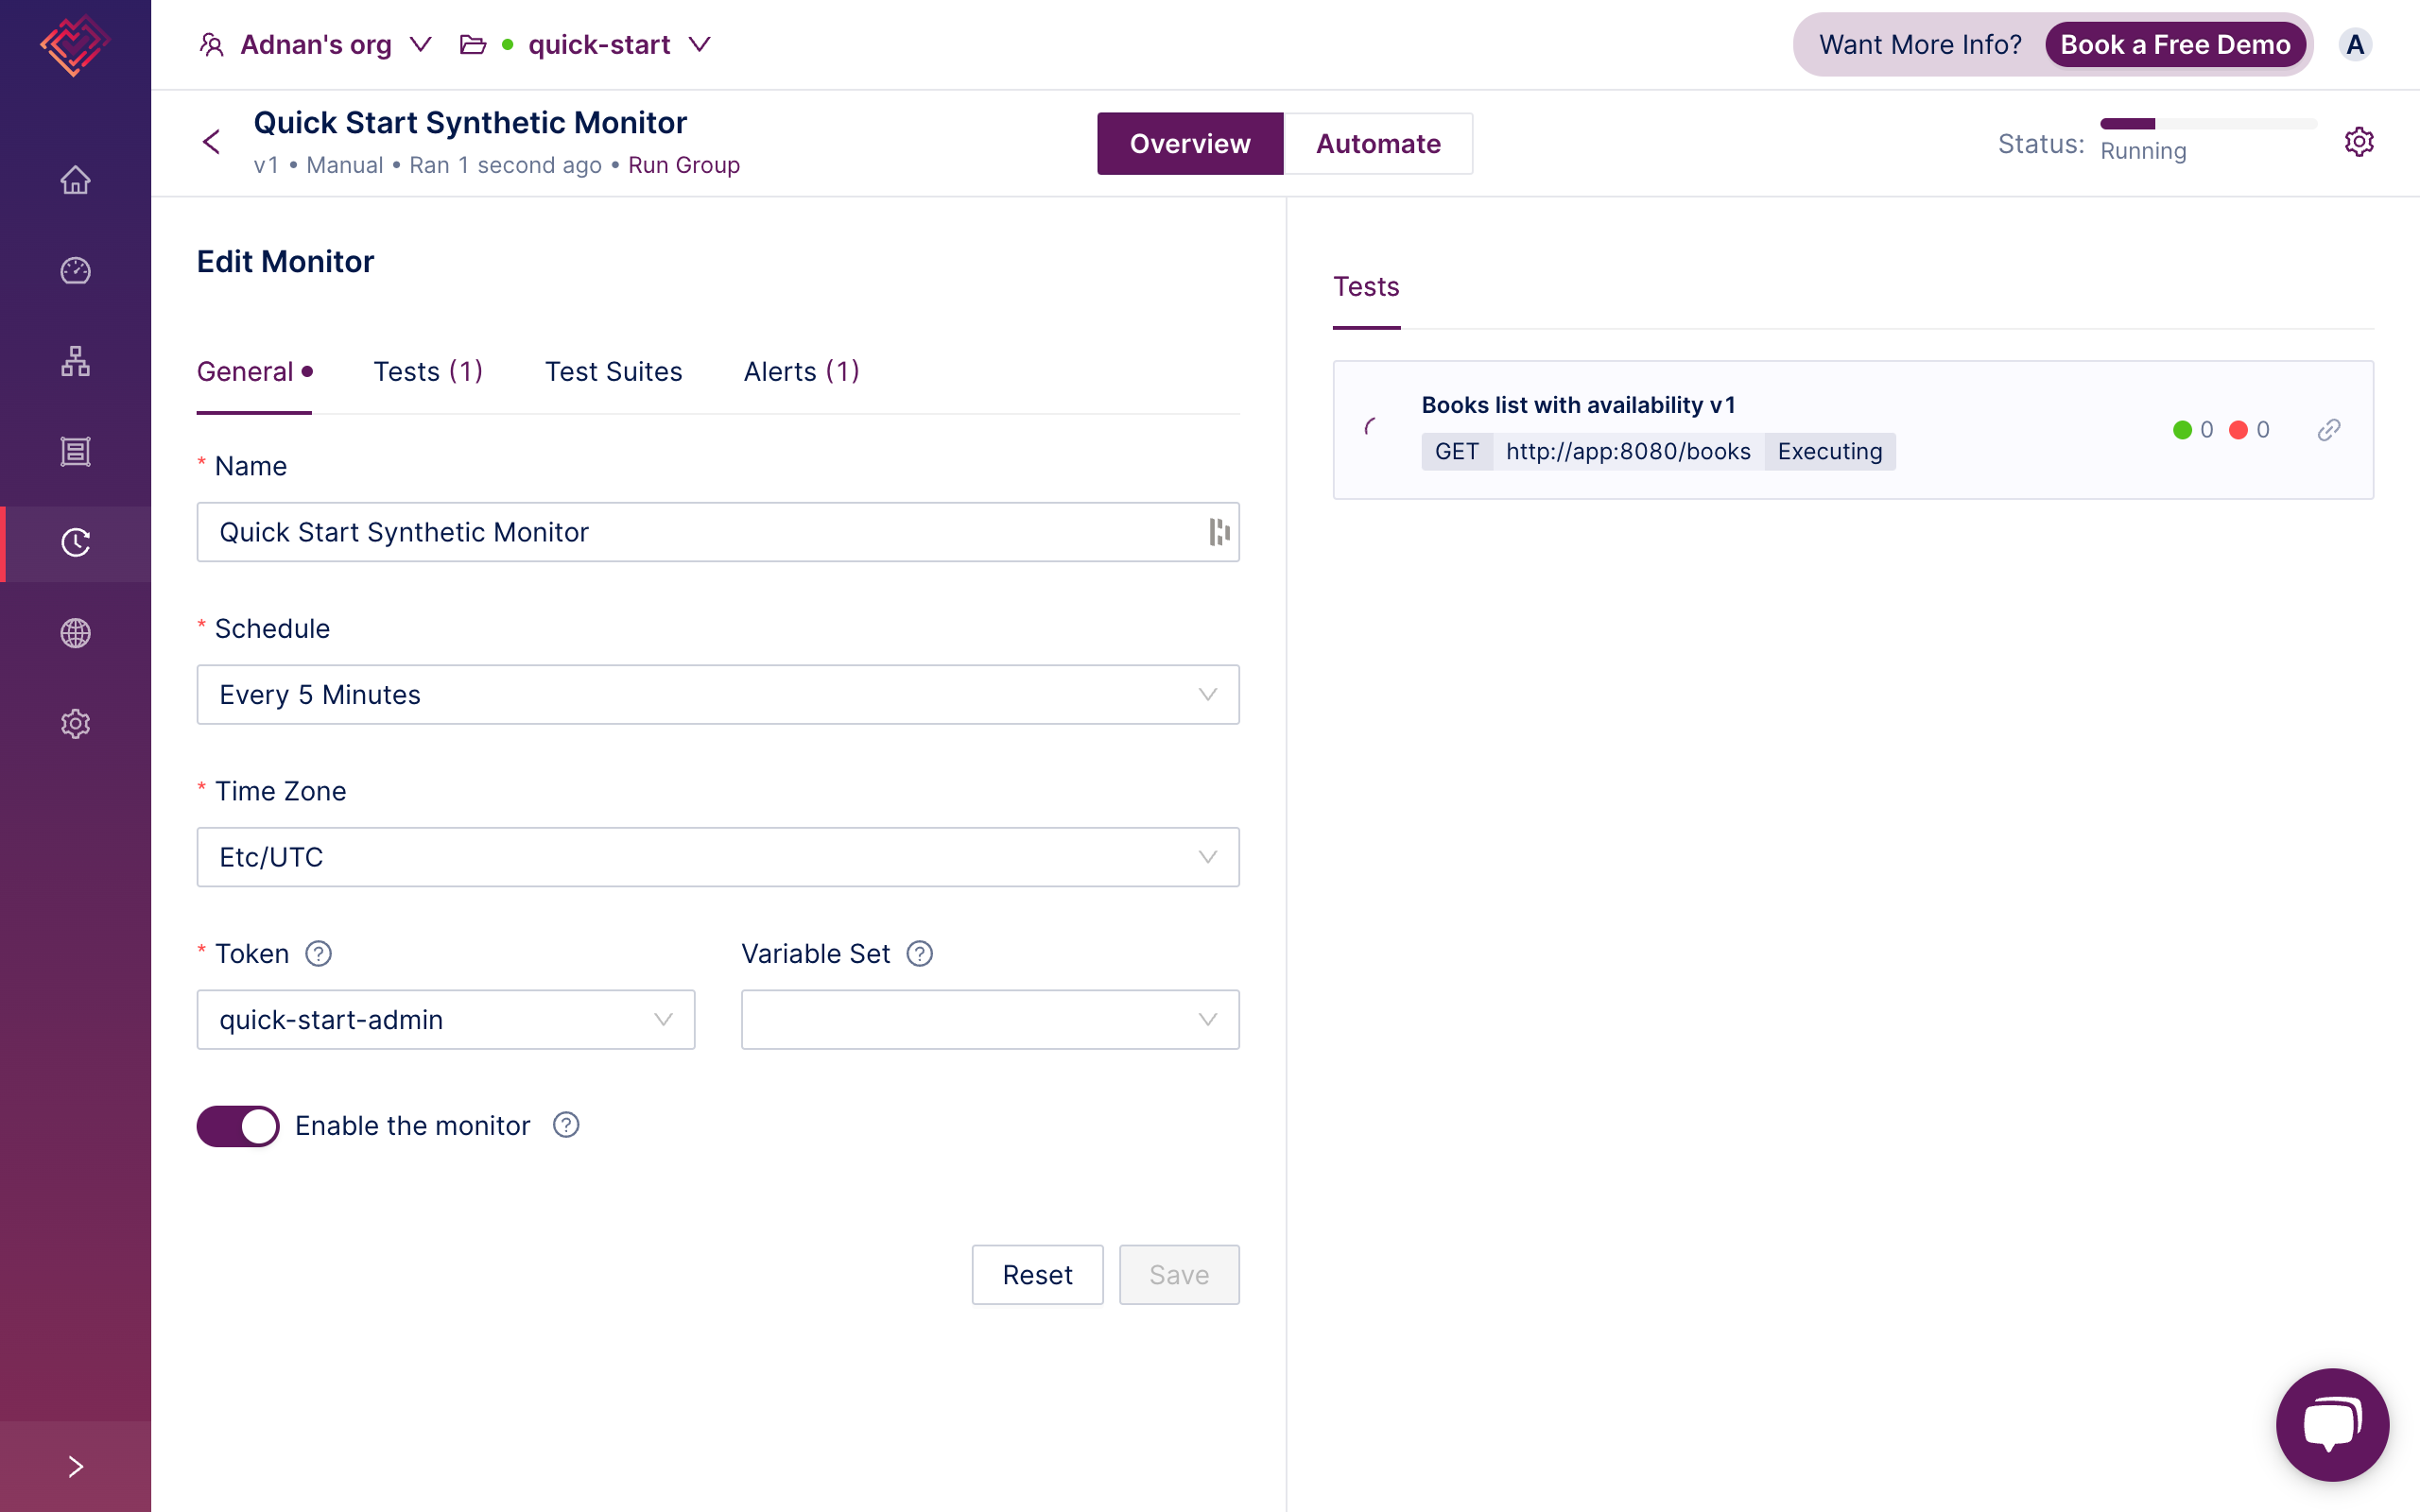
- To view the YAML definition for the Monitor, click
Automate.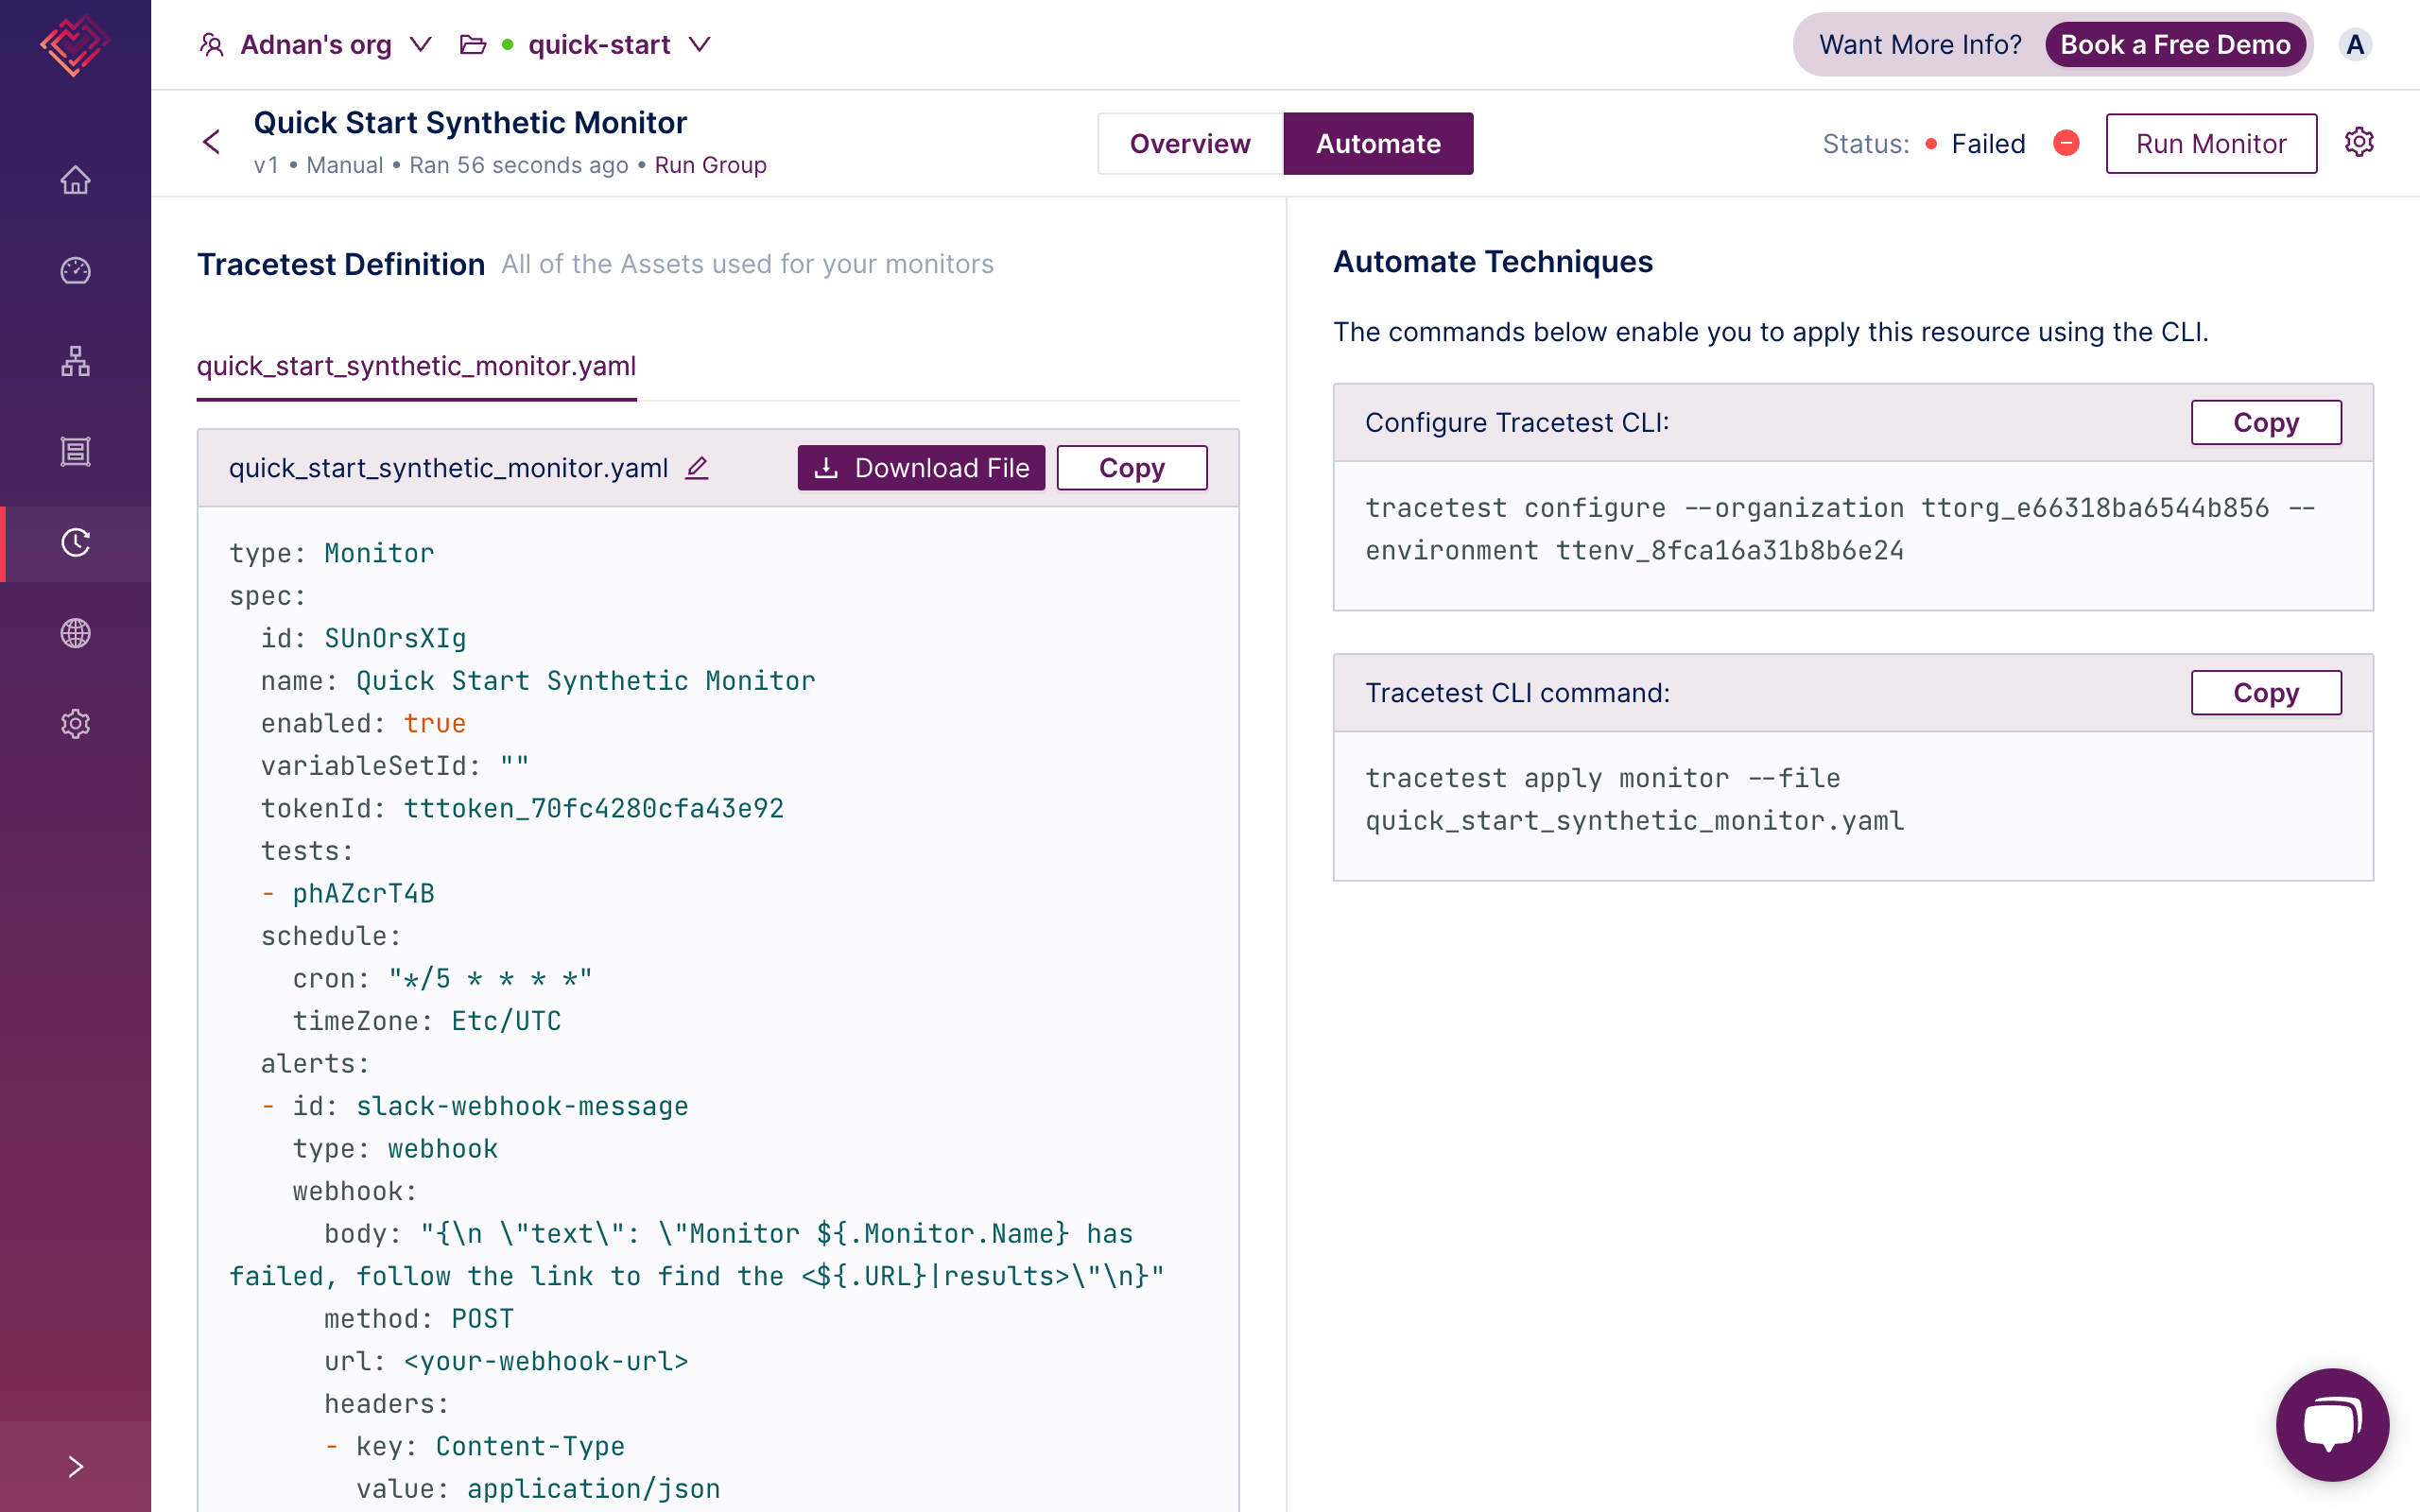
With this setup, your Monitor will trigger the Books list with availability test, defined in ./resources/test.yaml, every 5 minutes.
Learn More
Feel free to check out our examples in GitHub and join our Slack Community for more info!