Python with OpenTelemetry manual instrumention
Tracetest is a testing tool based on OpenTelemetry that allows you to test your distributed application. It allows you to use data from distributed traces generated by OpenTelemetry to validate and assert if your application has the desired behavior defined by your test definitions.
Python app with OpenTelemetry Collector and Tracetest
This is a simple quick start on how to configure a Python app to use OpenTelemetry instrumentation with traces, and Tracetest for enhancing your e2e and integration tests with trace-based testing.
Prerequisites
Tracetest Account:
- Sign up to
app.tracetest.ioor follow the get started docs. - Have access to the environment's agent API key.
Docker: Have Docker and Docker Compose installed on your machine.
Run This Quckstart Example
The example below is provided as part of the Tracetest project. You can download and run the example by following these steps:
Clone the Tracetest project and go to the Node.js Quickstart with Manual Instrumentation:
git clone https://github.com/kubeshop/tracetest
cd tracetest/examples/quick-start-python
Follow these instructions to run the quick start:
- Copy the
.env.templatefile to.env. - Fill out the TRACETEST_TOKEN and ENVIRONMENT_ID details by editing your
.envfile. - Run
docker compose run tracetest-run. - Follow the links in the output to view the test results.
Follow along with the sections below for a detailed breakdown of what the example you just ran did and how it works.
Project Structure
The quick start Python project is built with Docker Compose and contains the Tracetest Agent and a Python Flask app.
The docker-compose.yaml file in the root directory of the quick start runs the Python app and the Tracetest Agent setup.
Configuring the Python App
The Python app is a simple Flask app, contained in the app.py file.
Configure the .env like shown below.
# Get the required information here: https://app.tracetest.io/retrieve-token

TRACETEST_TOKEN="<YOUR_TRACETEST_TOKEN>"
TRACETEST_ENVIRONMENT_ID="<YOUR_ENV_ID>"

# GRPC
OTEL_EXPORTER_OTLP_TRACES_ENDPOINT="http://tracetest-agent:4317/"
# or, use HTTP
# OTEL_EXPORTER_OTLP_TRACES_ENDPOINT="http://tracetest-agent:4318/v1/traces"
The OpenTelemetry tracing is contained both as automatic and manual instrumentation. Traces will be sent to the Tracetest Agent. Here's the requirements.txt with OpenTelemetry libraries.
flask
opentelemetry-distro
opentelemetry-exporter-otlp
Automatic instrumentation is configured in the Dockerfile and the docker-compose.yaml. The command field will include opentelemetry-instrument.
FROM python:3.10.1-slim
WORKDIR /opt/app
COPY . .
RUN pip install --no-cache-dir -r requirements.txt
RUN opentelemetry-bootstrap -a install
EXPOSE 8080
The docker-compose.yaml contains just one service for the Python app. The service is started with the command parameter.
command: opentelemetry-instrument --traces_exporter otlp --service_name app --exporter_otlp_endpoint ${OTEL_EXPORTER_OTLP_TRACES_ENDPOINT} --exporter_otlp_insecure true flask run --host=0.0.0.0 --port=8080
Manual instrumentation is configured in the app.py.
from flask import Flask, request
import json

from opentelemetry import trace
from opentelemetry.sdk.resources import Resource
from opentelemetry.sdk.trace import TracerProvider
from opentelemetry.sdk.trace.export import BatchSpanProcessor
from opentelemetry.sdk.trace.export import ConsoleSpanExporter

provider = TracerProvider()
processor = BatchSpanProcessor(ConsoleSpanExporter())
provider.add_span_processor(processor)
trace.set_tracer_provider(provider)
tracer = trace.get_tracer(__name__)
There are 3 endpoints in the Flask app. To see manual instrumentation, trigger the "/manual" endpoint. To see the automatic instrumentation, trigger the "/automatic" endpoint respectively.
app = Flask(__name__)

@app.route("/manual")
def manual():
    with tracer.start_as_current_span(
        "manual",
        attributes={ "endpoint": "/manual", "foo": "bar" }
    ):
        return "App works with a manual instrumentation."

@app.route('/automatic')
def automatic():
    return "App works with automatic instrumentation."

@app.route("/")
def home():
    return "App works."
Running the Python App and Tracetest
To execute the tests, run this command:
docker compose run tracetest-run
This will:
- Start the Python app, the OpenTelemetry Collector, and send the traces to the Tracetest Agent.
- Start the Tracetest Agent.
- Configure the tracing backend and create tests in your environment.
- Run the tests.
The output of the test will look similar to this:
Configuring Tracetest
 SUCCESS  Successfully configured Tracetest CLI
Running Trace-Based Tests...
✔ RunGroup: #E1qhw_jIg (https://app.tracetest.io/organizations/xxx/environments/xxx/run/E1qhw_jIg)
 Summary: 1 passed, 0 failed, 0 pending
  ✔ Python API (https://app.tracetest.io/organizations/xxx/environments/xxx/test/W656Q0c4g/run/2/test) - trace id: c0eaebfe3ab66360a98d5cd443760a3c
	✔ It should return status 200.
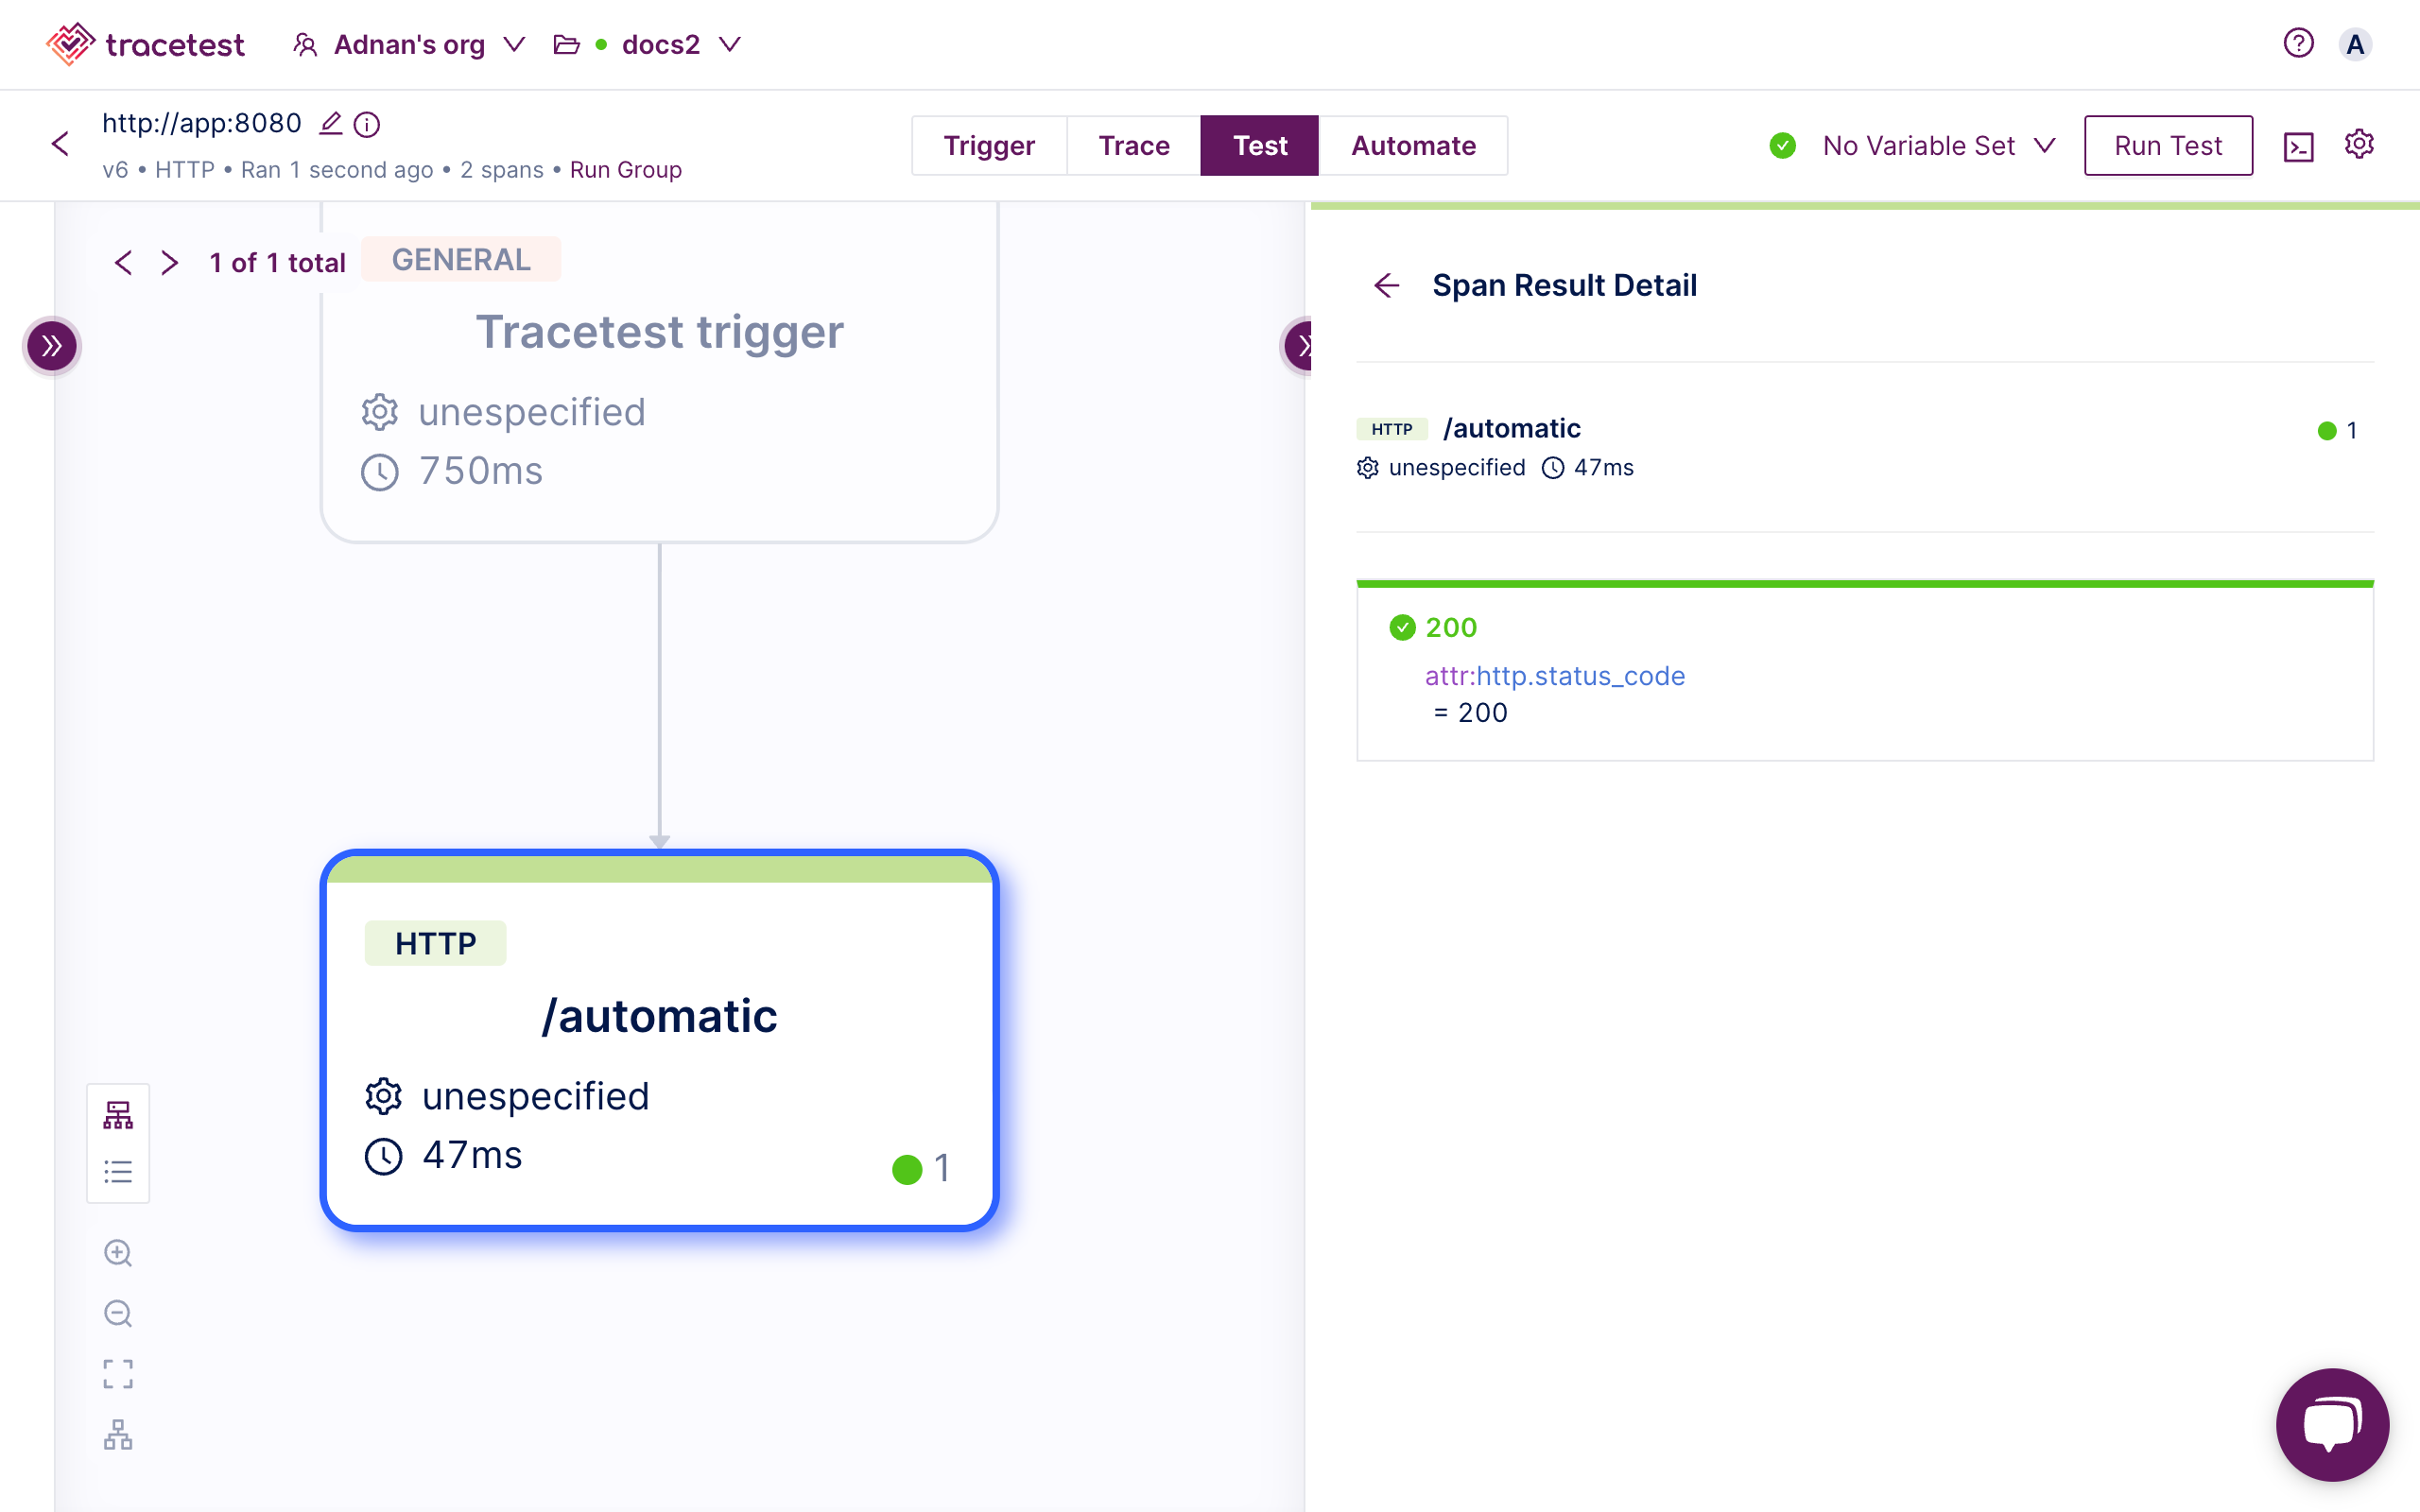
Here's what that looks like in the WebUI.
Selector:
span[tracetest.span.type="http" name="/automatic" http.target="/automatic" http.method="GET"]
Assertion:
attr:http.status_code = 200
Feel free to check out our examples in GitHub, and join our Slack Community for more info!