Node.js and OpenTelemetry Manual Instrumentation
Tracetest is a testing tool based on OpenTelemetry that allows you to test your distributed application. It allows you to use data from distributed traces generated by OpenTelemetry to validate and assert if your application has the desired behavior defined by your test definitions.
Node.js app with OpenTelemetry Manual Instrumentation and Tracetest
This is a simple quick start on how to configure a Node.js app to use OpenTelemetry instrumentation with traces, and Tracetest for enhancing your E2E and integration tests with trace-based testing. This example includes manual instrumentation and a sample bookstore array that simulates fetching data from a database.
Prerequisites
Tracetest Account:
- Sign up to
app.tracetest.ioor follow the get started docs. - Have access to the environment's agent API key.
Docker: Have Docker and Docker Compose installed on your machine.
Run This Quickstart Example
The example below is provided as part of the Tracetest project. You can download and run the example by following these steps:
Clone the Tracetest project and go to the Node.js Quickstart with Manual Instrumentation:
git clone https://github.com/kubeshop/tracetest
cd tracetest/examples/quick-start-nodejs-manual-instrumentation
Follow these instructions to run the quick start:
- Copy the
.env.templatefile to.env. - Fill out the TRACETEST_TOKEN and ENVIRONMENT_ID details by editing your
.envfile. - Run
docker compose run tracetest-run. - Follow the links in the output to view the test results.
Follow along with the sections below for a detailed breakdown of what the example you just ran did and how it works.
Project Structure
The quick start Node.js project is built with Docker Compose and contains the Tracetest Agent and a Node.js app.
The docker-compose.yaml file in the root directory of the quick start runs the Node.js app and the Tracetest Agent setup.
Configuring the Node.js App
The Node.js app is a simple Express app, contained in the app.js file.
Configure the .env like shown below.
# Get the required information here: https://app.tracetest.io/retrieve-token

TRACETEST_TOKEN="<YOUR_TRACETEST_TOKEN>"
TRACETEST_ENVIRONMENT_ID="<YOUR_ENV_ID>"

# GRPC
OTEL_EXPORTER_OTLP_TRACES_ENDPOINT="http://tracetest-agent:4317/"
# or, use HTTP
# OTEL_EXPORTER_OTLP_TRACES_ENDPOINT="http://tracetest-agent:4318/v1/traces"
The OpenTelemetry tracing is contained in the tracing.otel.grpc.js or tracing.otel.http.js files. Traces will be sent to Tracetest Agent.
Choosing the tracing.otel.grpc.js file will send traces to Tracetest Agent's GRPC endpoint.
Enabling the tracer is done by preloading the trace file. As seen in the package.json.
"scripts": {
  "app-with-grpc-tracer": "node -r ./tracing.otel.grpc.js app.js",
  "availability-with-grpc-tracer": "node -r ./tracing.otel.grpc.js availability.js",
},
Running the Node.js App and Tracetest
To execute the tests, run this command:
docker compose run tracetest-run
This will:
- Start the Node.js app, the OpenTelemetry Collector, and send the traces to the Tracetest Agent.
- Start the Tracetest Agent.
- Configure the tracing backend and create tests in your environment.
- Run the tests.
The output of the test will look similar to this:
Configuring Tracetest
SUCCESS Successfully configured Tracetest CLI
Running Trace-Based Tests...
✘ RunGroup: #gcMqU_jIR (https://app.tracetest.io/organizations/xxx/environments/xxx/run/gcMqU_jIR)
Summary: 0 passed, 1 failed, 0 pending
✘ Books list with availability (https://app.tracetest.io/organizations/xxx/environments/xxx/test/phAZcrT4B/run/10/test) - trace id: 7b92f5f6633218bbaacf0b79fe9c8904
✔ span[tracetest.span.type="http" name="GET /books" http.target="/books" http.method="GET"]
✔ #b0dfd9d58a43a950
✔ attr:tracetest.span.duration < 500ms (30ms)
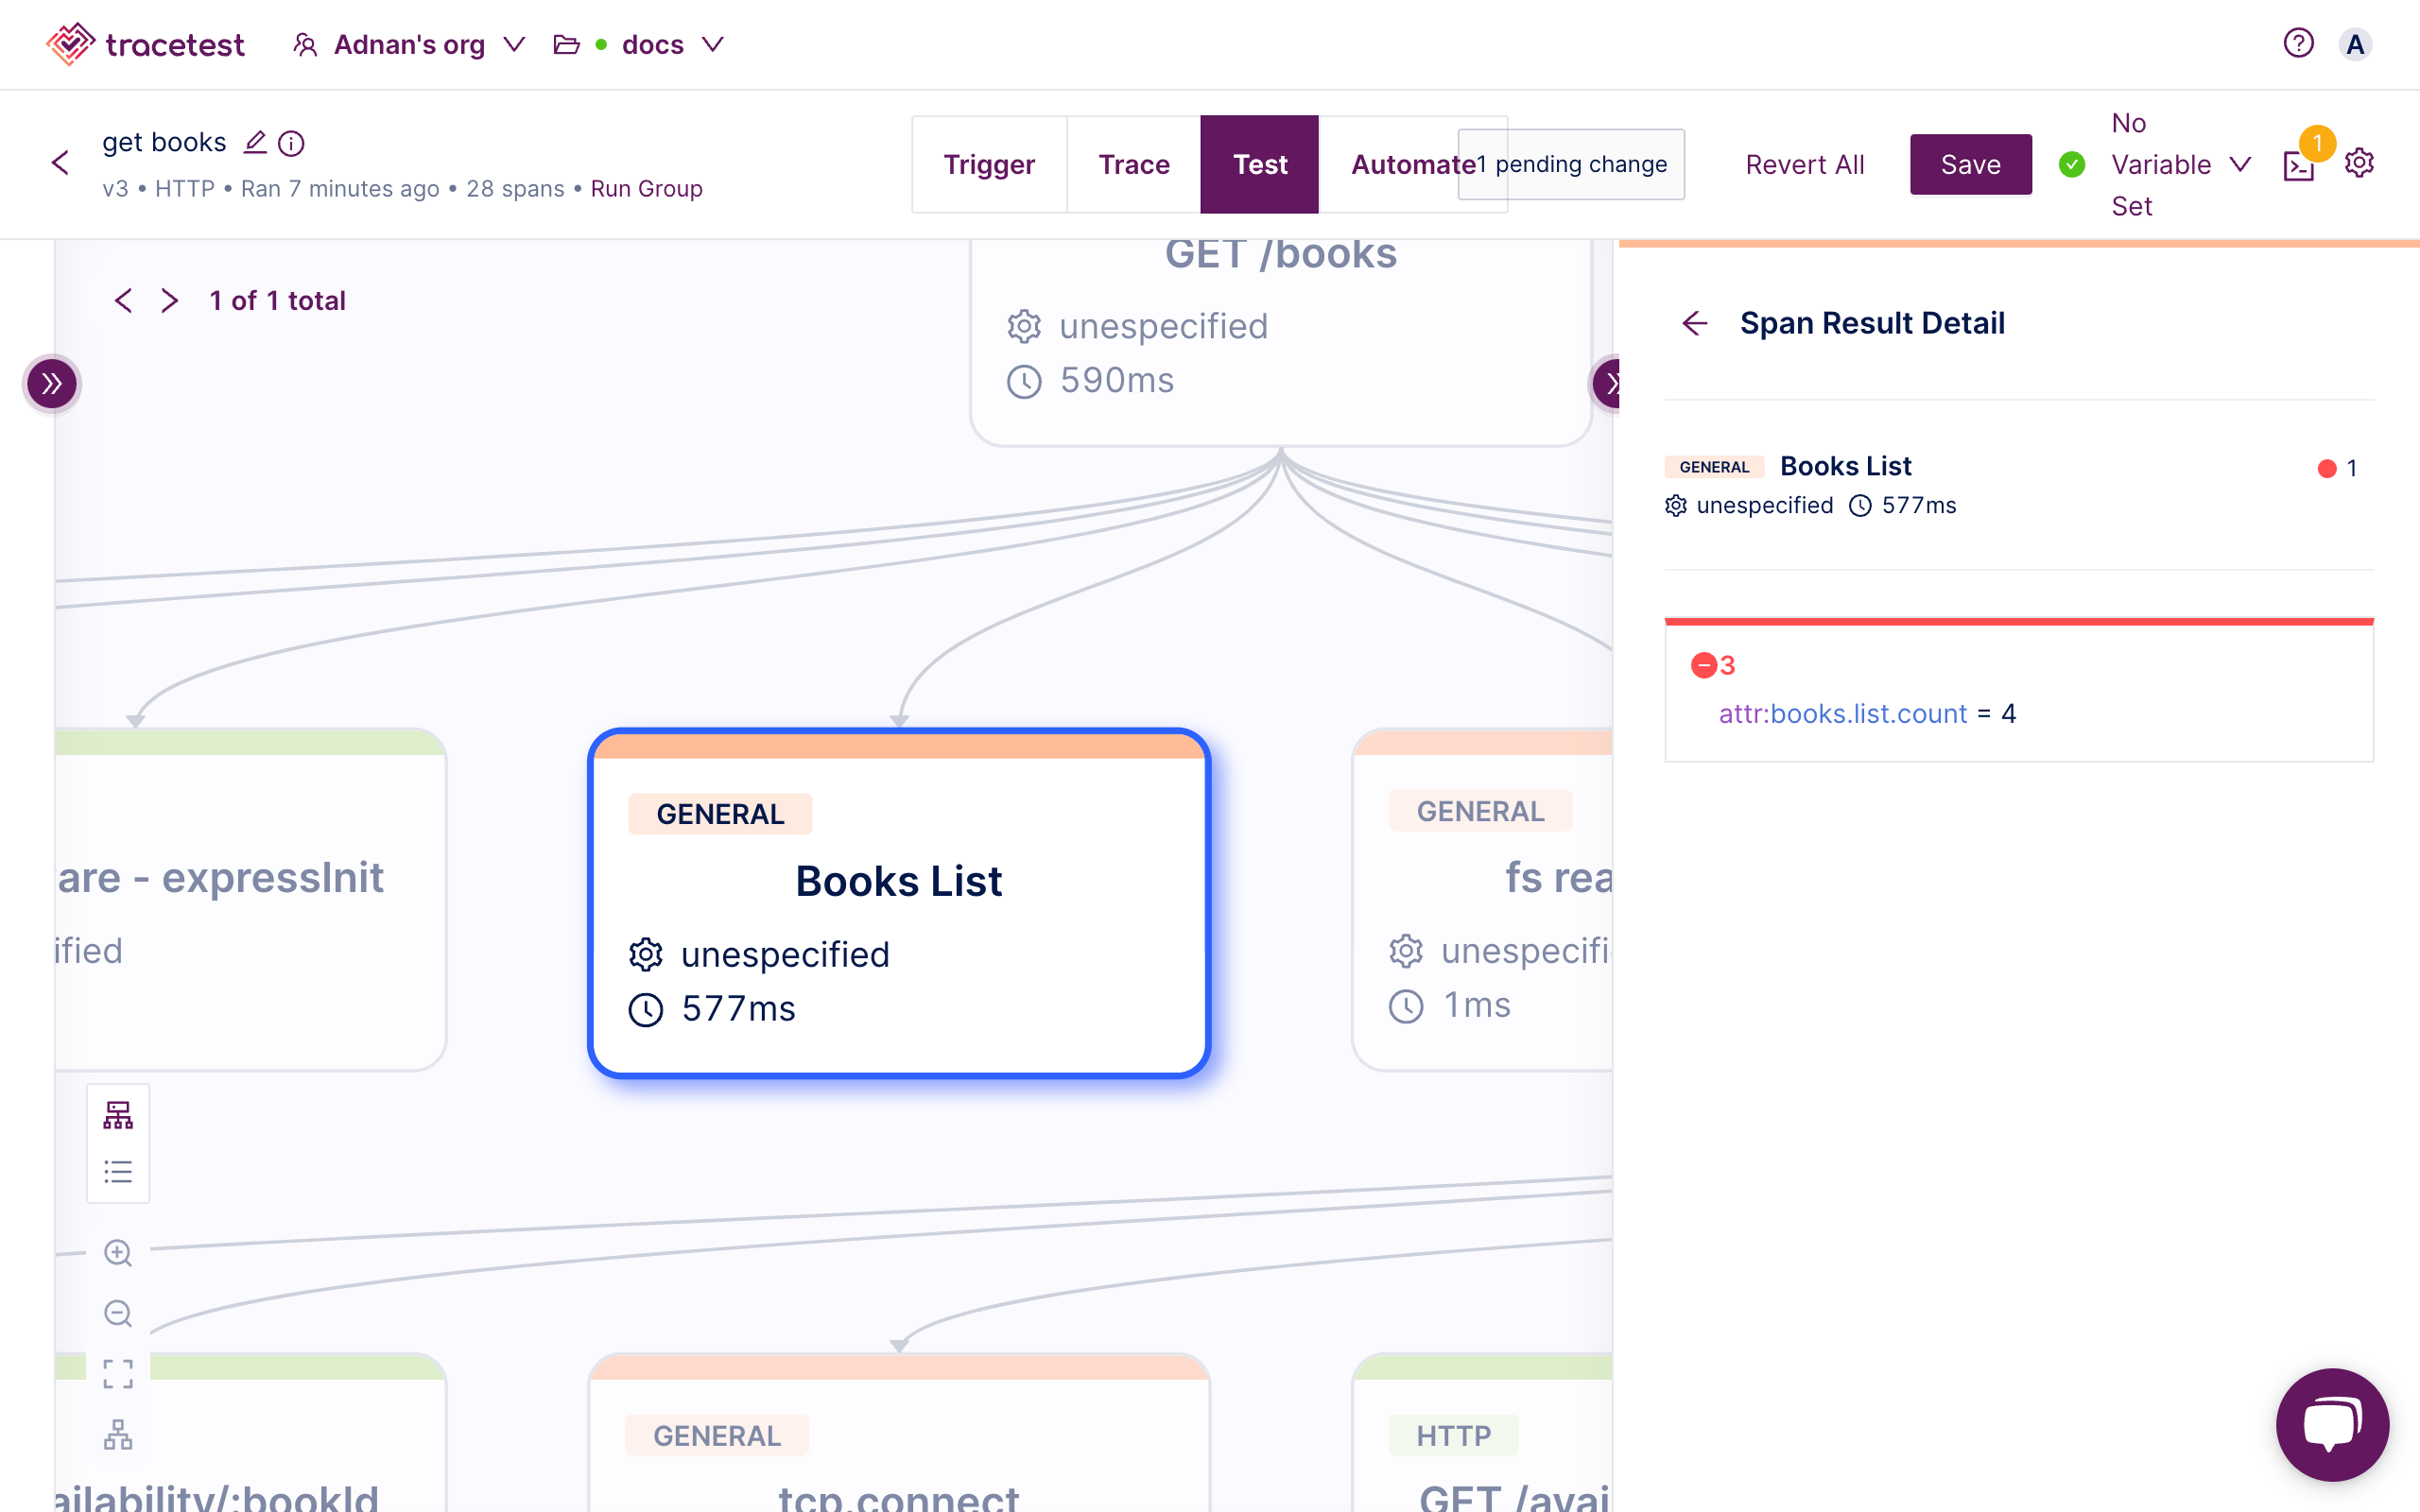
✔ span[tracetest.span.type="general" name="Books List"]
✔ #8155143d27cbb3ab
✔ attr:books.list.count = 3 (3)
✔ span[tracetest.span.type="http" name="GET /availability/:bookId" http.method="GET"]
✔ #1e2fcb5cefc171b5
✔ attr:http.host = "availability:8080" (availability:8080)
✔ #3e1fc86271bf1192
✔ attr:http.host = "availability:8080" (availability:8080)
✔ #9f29960c92ca268a
✔ attr:http.host = "availability:8080" (availability:8080)
✘ span[tracetest.span.type="general" name="Availablity check"]
✔ #d191cefe48e65c74
✔ attr:isAvailable = "true" (true)
✔ #27989492723fd49a
✔ attr:isAvailable = "true" (true)
✘ #89e0d3b186bc7f0d
✘ attr:isAvailable = "true" (false) (https://app.tracetest.io/organizations/xxx/environments/xxx/test/phAZcrT4B/run/10/test?selectedAssertion=3&selectedSpan=89e0d3b186bc7f0d)
✘ Required gates
✘ test-specs
Learn More
Feel free to check out our examples in GitHub and join our Slack Community for more info!