Node.js and Azure Application Insights with OpenTelemetry Collector
Tracetest is a testing tool based on OpenTelemetry that allows you to test your distributed application. It allows you to use data from distributed traces generated by OpenTelemetry to validate and assert if your application has the desired behavior defined by your test definitions.
Azure Application Insights is an extension of Azure Monitor and provides application performance monitoring (APM) features. APM tools are useful to monitor applications from development, through test, and into production in the following ways:
- Proactively understand how an application is performing.
- Reactively review application execution data to determine the cause of an incident.
OpenTelemetry Collector Contrib - The official OpenTelemetry Distribution for packages outside of the core collector.
Node.js App with Azure Application Insights, OpenTelemetry Collector and Tracetest
This is a simple quick start guide on how to configure a Node.js app to use instrumentation with traces and Tracetest for enhancing your E2E and integration tests with trace-based testing. The infrastructure will use Azure App Insights as the trace data store, the OpenTelemetry Collector to process and route the telemetry data and a Node.js app to generate it.
Prerequisites
Tracetest Account:
- Sign up to
app.tracetest.ioor follow the get started docs. - Have access to the environment's agent API key.
Azure Account:
- Sign up to Azure.
- Install Azure CLI.
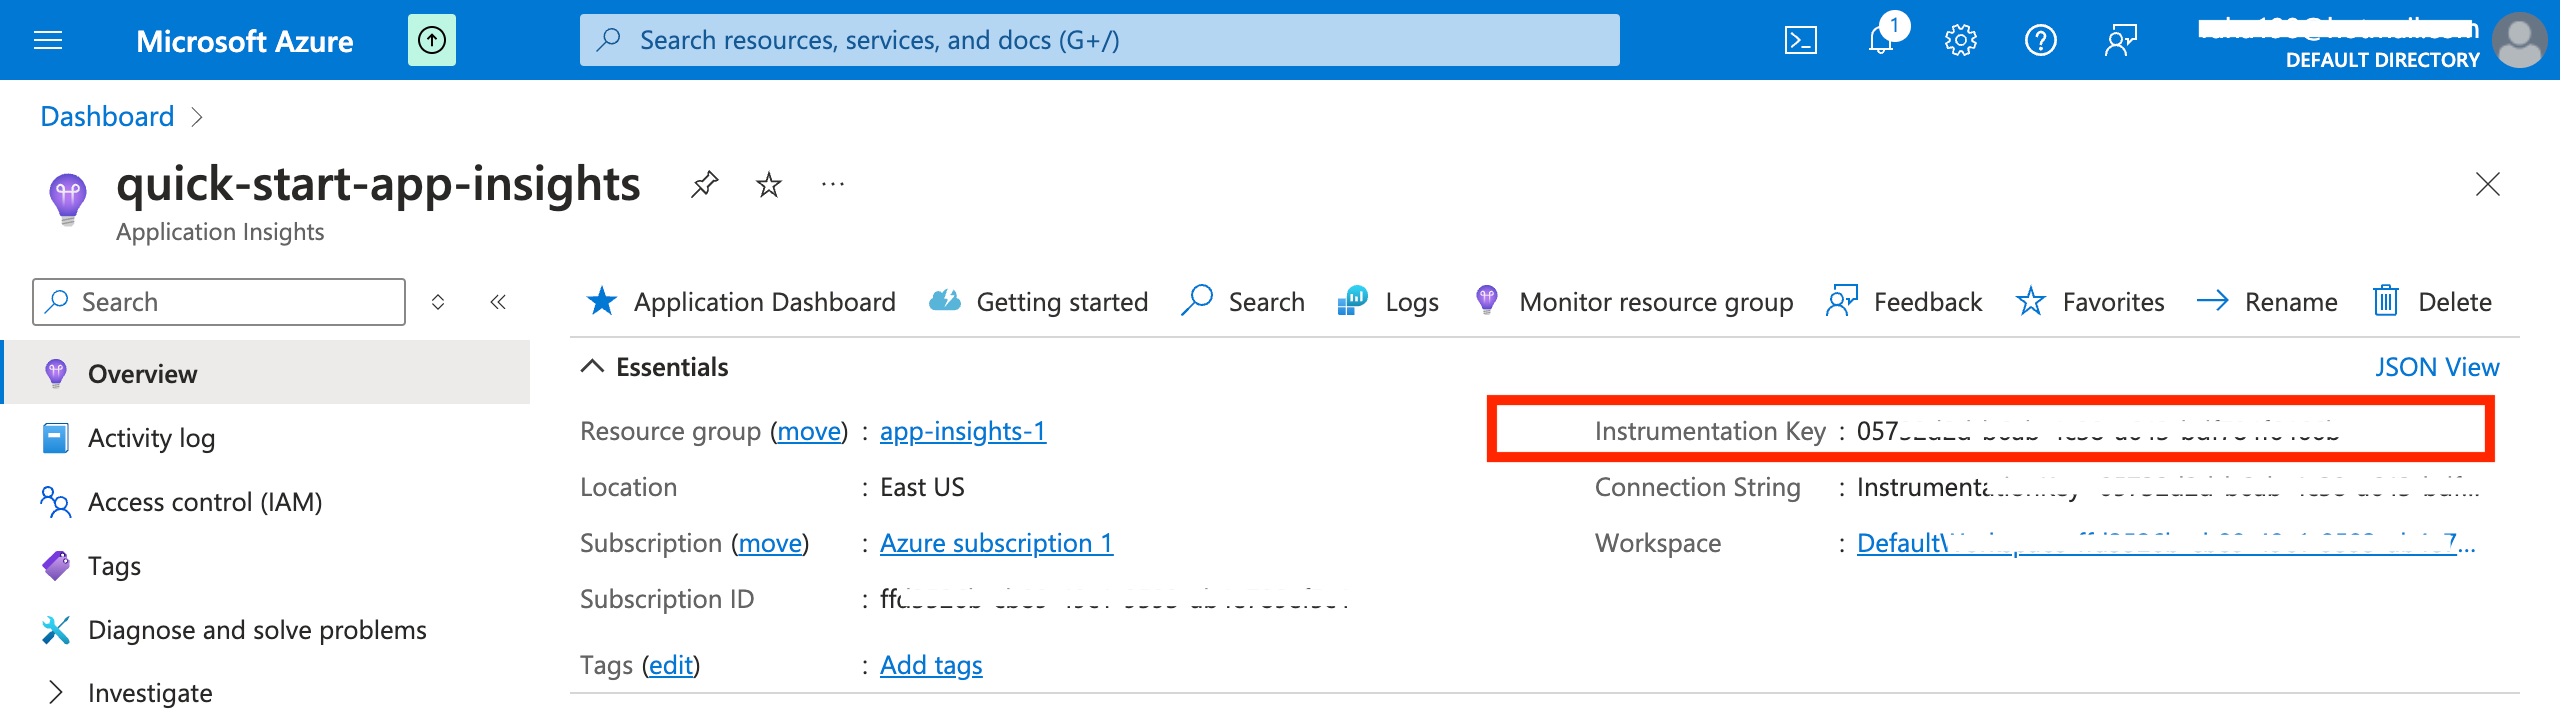
- Create an Application Insights app and get a Instrumentation Key.
Docker: Have Docker and Docker Compose installed on your machine.
Run This Quckstart Example
The example below is provided as part of the Tracetest project. You can download and run the example by following these steps:
Clone the Tracetest project and go to the Azure Node.js Quickstart:
git clone https://github.com/kubeshop/tracetest
cd tracetest/examples/tracetest-azure-app-insights-collector
Follow these instructions to run the quick start:
- Copy the
.env.templatefile to.env. - Fill out the TRACETEST_TOKEN and ENVIRONMENT_ID details by editing your
.envfile. - Fill out the APP_INSIGHTS_INSTRUMENTATION_STRING details by editing your
.envfile. - Run
docker compose run tracetest-run. - Follow the links in the output to view the test results.
Follow along with the sections below for an in detail breakdown of what the example you just ran did and how it works.
Project Structure
The project contains the Tracetest Agent, and a Node.js app.
The docker-compose.yaml file in the root directory of the quick start runs the Node.js app, Elasticsearch, Elastic APM server, OpenTelemetry Collector, and the Tracetest Agent setup.
Configuring the Node.js App
The Node.js app is a simple Express app, contained in the app.js file.
Configure the .env like shown below.
TRACETEST_API_KEY="<YOUR_TRACETEST_API_KEY>"
The OpenTelemetry tracing is contained in the tracing.js file. Traces will be sent to Azure Application Insights.
The tracing.js file will send traces to the Azure Application Insights endpoint.
Enabling the tracer is done by preloading the trace file. As seen in the package.json.
"scripts": {
  "start": "node -r ./tracing.js app.js"
},
Configuring Azure Application Insights
Create an Application Insights resource in your Azure account. Copy the Instrumentation Key.
Configure the .env like shown below.
# Get the required information here: https://app.tracetest.io/retrieve-token

TRACETEST_API_KEY="<YOUR_TRACETEST_API_KEY>"
TRACETEST_API_TOKEN="<YOUR_TRACETEST_TOKEN>"

# Azure
APP_INSIGHTS_INSTRUMENTATION_STRING="InstrumentationKey=14f0532a-aad4-4cb1-9bdb-64d021622efd;IngestionEndpoint=https://eastus-8.in.applicationinsights.azure.com/;LiveEndpoint=https://eastus.livediagnostics.monitor.azure.com/"
Running the Tests
The docker-compose.yaml file in the root directory contains the Node.js app, OpenTelemetry Collector and Tracetest Agent.
To run everything including Tracetest tests, run this command:
docker compose run tracetest-run
This will:
- Start the Node.js app and send the traces to Azure App Insights.
- Start the Tracetest Agent.
- Configure the Azure App Insights tracing backend and create tests in your environment.
- Run the tests.
The Test File
Check out the resources/test.yaml file.
# resources/test.yaml
type: Test
spec:
  id: W656Q0c4g
  name: Test API
  description: Test the App.
  trigger:
    type: http
    httpRequest:
      method: GET
      url: http://app:8080
      headers:
        - key: Content-Type
          value: application/json
  specs:
    - selector: span[tracetest.span.type="http" name="GET /"]
      assertions:
        - attr:http.status_code  =  200
        - attr:tracetest.span.duration  <  500ms
Learn More
Please visit our examples in GitHub and join our Slack Community for more info!