Configure Trace Ingestion
Tracetest Agent runs alongside your apps, in the same environment/network, to do two things:
- Run tests against your apps.
- Ingest traces from your apps.
This page explains (2), how to ingest traces into Tracetest Agent to enable trace-based testing.
Enable Trace Ingestion with an OTLP Endpoint
Create a file called trace-ingestion.yaml. And, run it with the CLI.
type: DataStore
spec:
  name: Opentelemetry Collector pipeline
  type: otlp
  default: true
tracetest apply datastore -f ./trace-ingestion.yaml
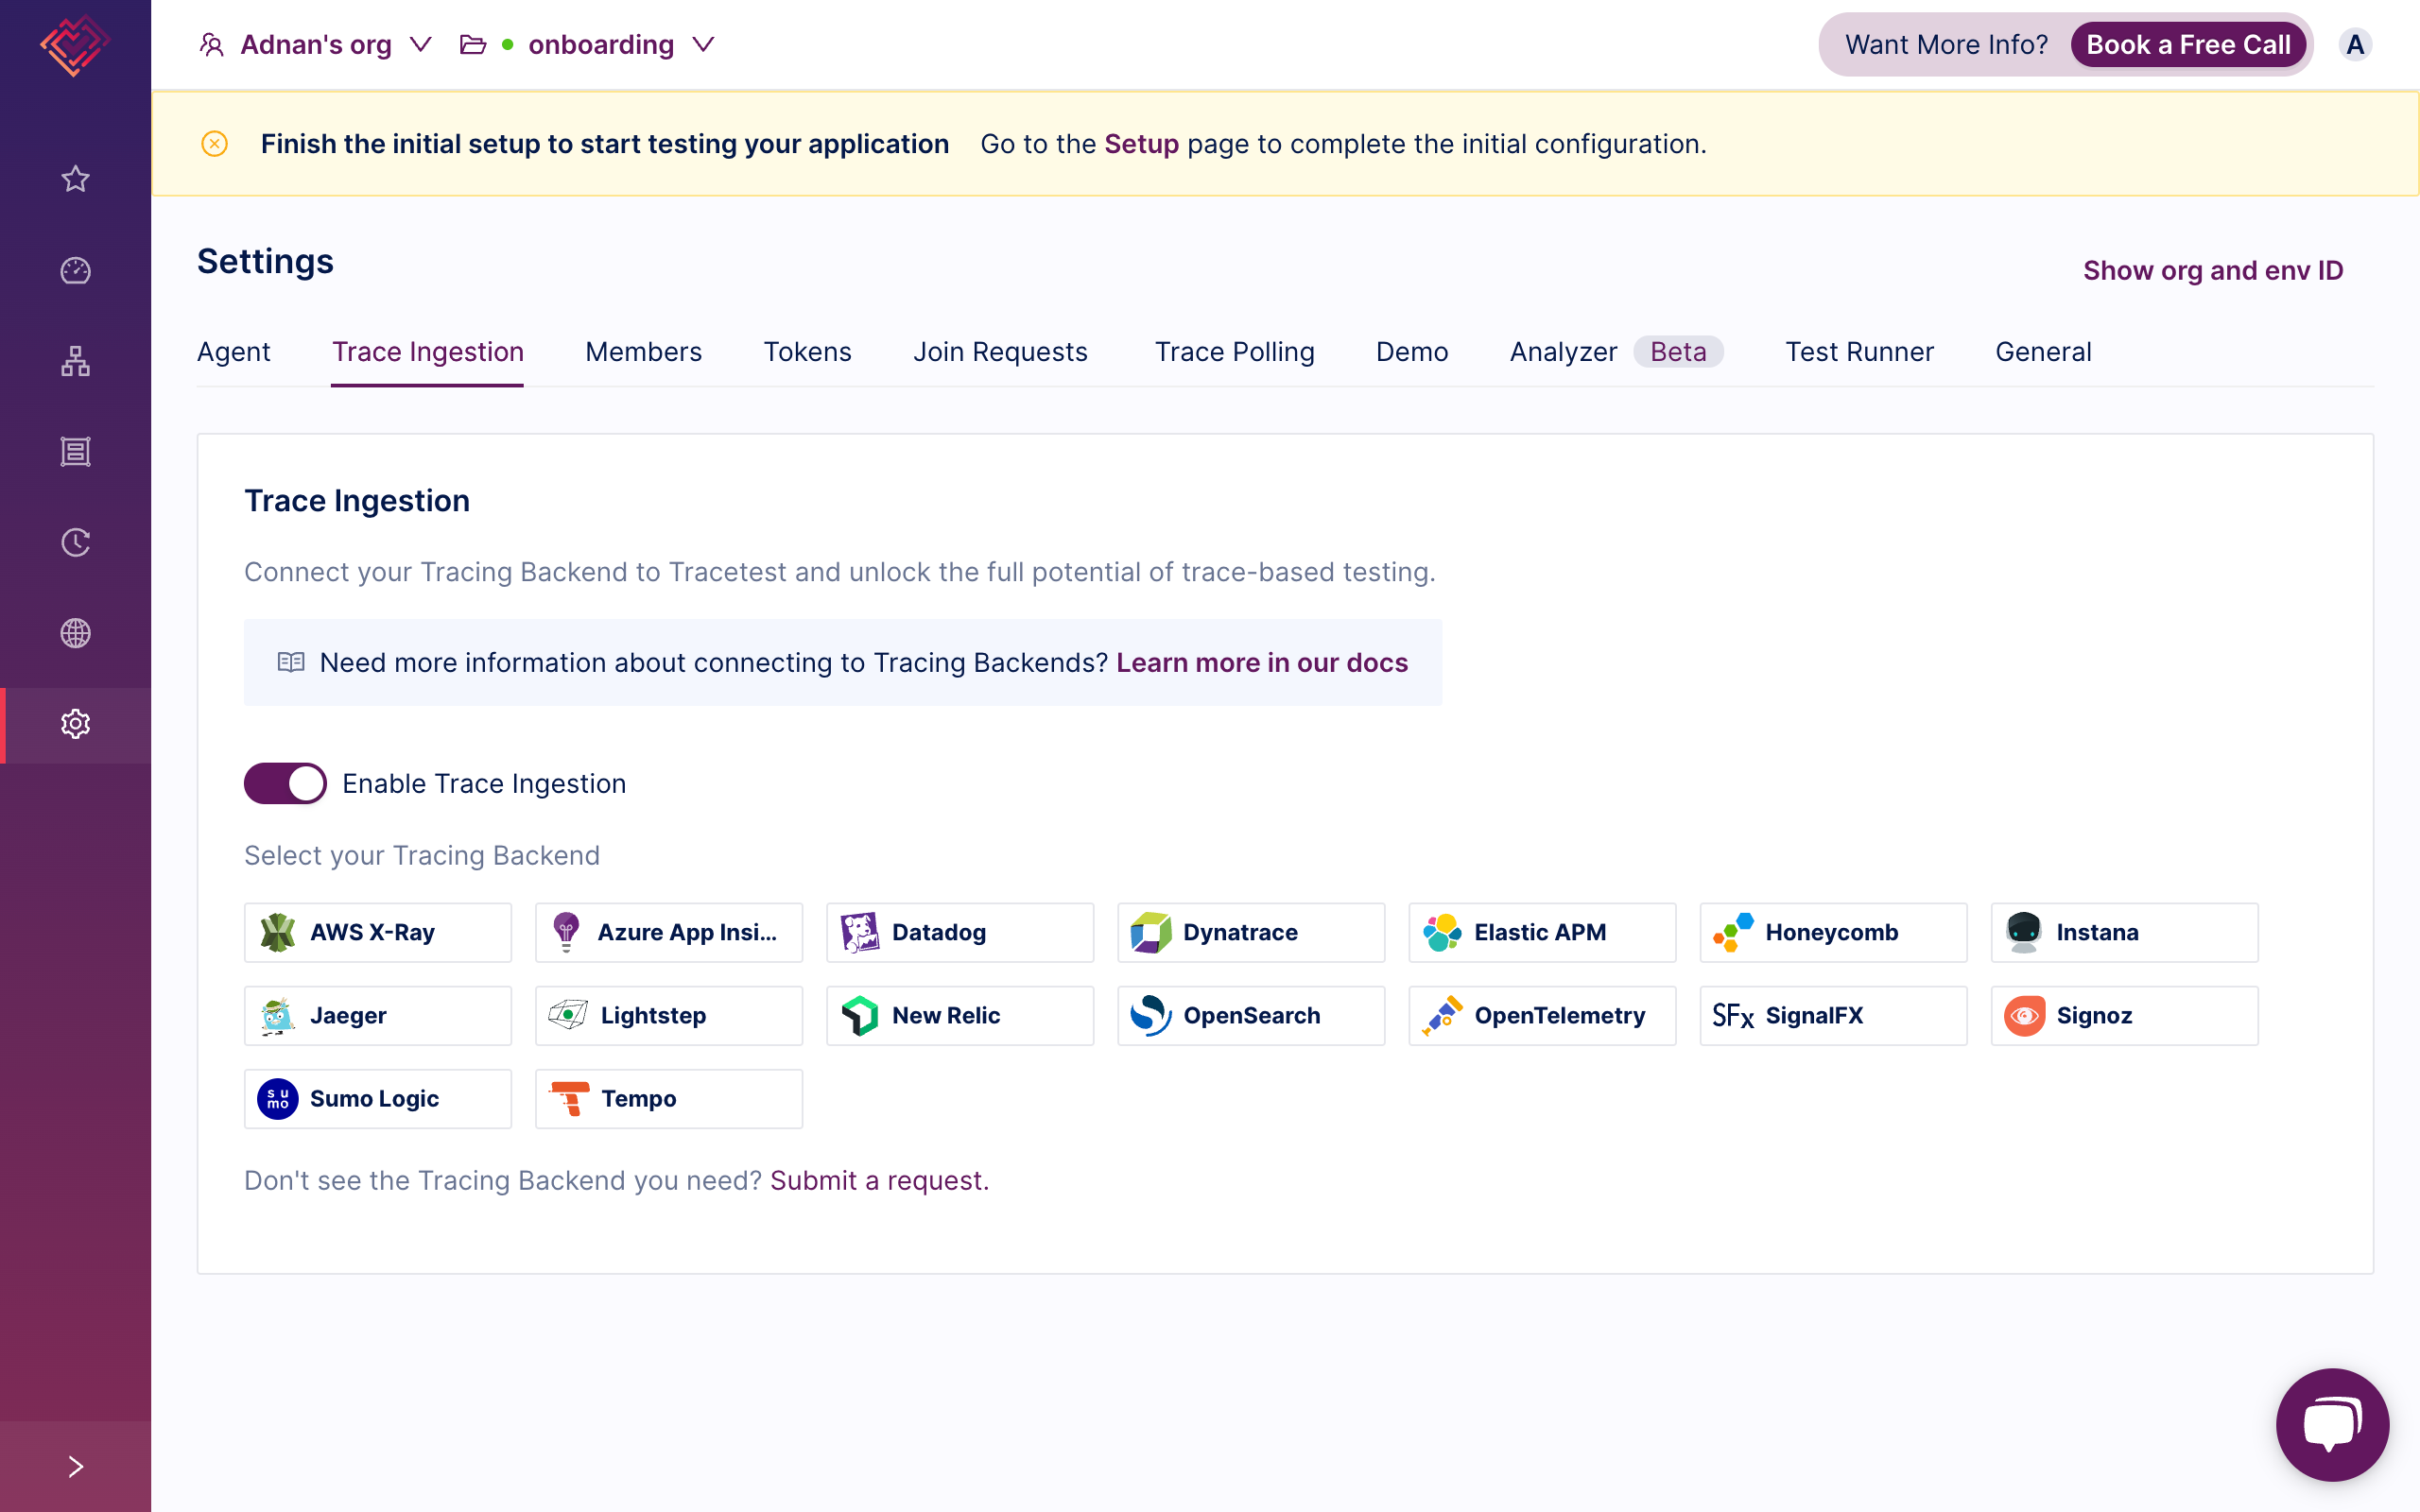
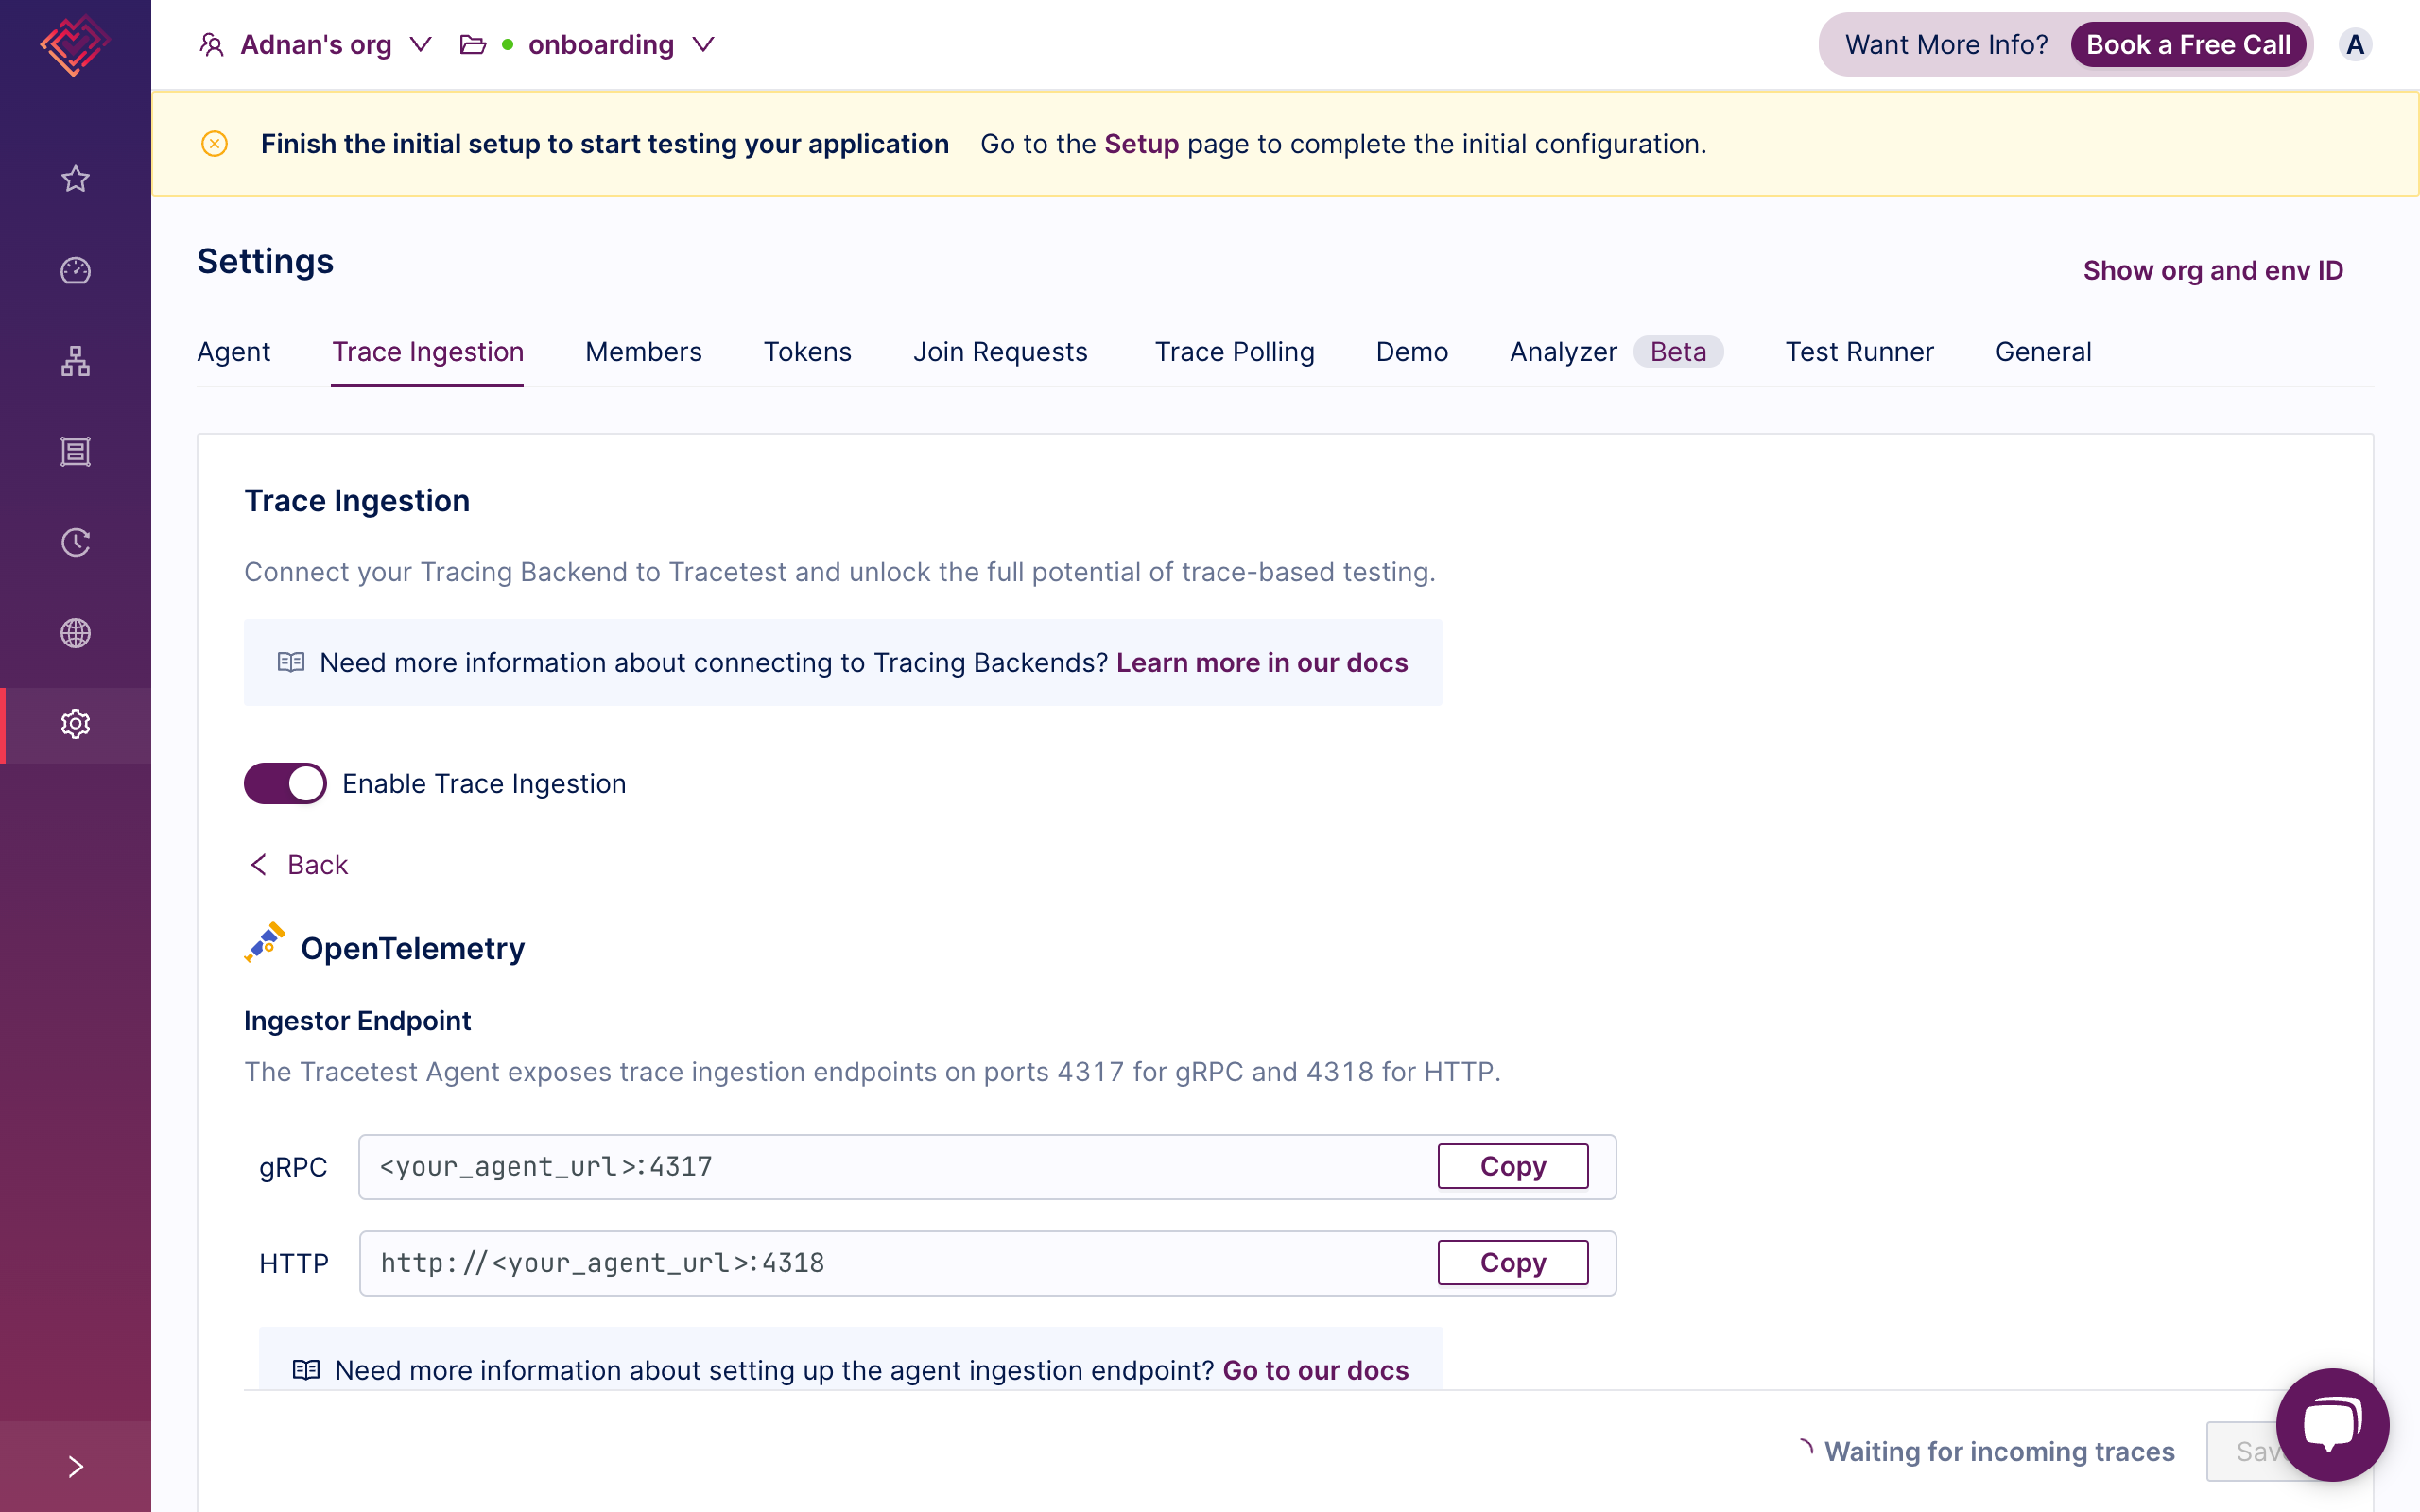
Or, use the Web UI. Go to Settings > Trace Ingestion. Toggle "Enable Trace Ingestion" to on and select OpenTelemetry.


Configure Trace Exporters to Send Traces to Tracetest Agent
Once configured, Tracetest Agent exposes OTLP ports 4317 (gRPC) and 4318 (HTTP) for trace ingestion. Configure your trace exporters to send traces to the Tracetest Agent OTLP endpoint.
- Tracetest CLI
- Docker
- Docker Compose
- Kubernetes
- Helm
With the Tracetest Agent running locally, the trace ingestion OTLP endpoints will be:
- gRPC:
http://localhost:4317 - HTTP:
http://localhost:4318/v1/traces
With the Tracetest Agent running in Docker with tracetest-agent as the service name, the trace ingestion OTLP endpoints will be:
- gRPC:
http://tracetest-agent:4317 - HTTP:
http://tracetest-agent:4318/v1/traces
With the Tracetest Agent running in Docker with tracetest-agent as the service name, the trace ingestion OTLP endpoints will be:
- gRPC:
http://tracetest-agent:4317 - HTTP:
http://tracetest-agent:4318/v1/traces
With the Tracetest Agent running in Kubernetes with tracetest-agent as the service name, the trace ingestion OTLP endpoints will be:
- gRPC:
http://tracetest-agent.default.svc.cluster.local:4317 - HTTP:
http://tracetest-agent.default.svc.cluster.local:4318/v1/traces
With the Tracetest Agent running in Kubernetes with agent as the Helm <release-name>, the trace ingestion OTLP endpoints will be:
- gRPC:
http://agent-tracetest-agent:4317 - HTTP:
http://agent-tracetest-agent:4318/v1/traces
OpenTelemetry auto-instrumentation allows you to send basic data quickly using the OpenTelemetry industry standard, before adding custom context.
- Node.js
- Python
- Go
- Java
- .NET
- Ruby
- Browser
- Docker
- Kubernetes
- OTel Collector
- Install Dependencies
npm install --save @opentelemetry/auto-instrumentations-node
- Initilize Tracing
Create an initialization file called tracing.js. Import it as the first step in your application lifecycle or include it with the -r / --require Node.js CLI option.
const opentelemetry = require('@opentelemetry/sdk-node');
const { OTLPTraceExporter } =  require('@opentelemetry/exporter-trace-otlp-http');
const { getNodeAutoInstrumentations } = require('@opentelemetry/auto-instrumentations-node');

const sdk = new opentelemetry.NodeSDK({
  // environment vars are loaded in the start step
  traceExporter: new OTLPTraceExporter(),
  instrumentations: [
    getNodeAutoInstrumentations({
      // we recommend disabling fs autoinstrumentation since it can be noisy and expensive during startup
      '@opentelemetry/instrumentation-fs': {
          enabled: false,
      },
    }),
  ],
});

sdk.start();
- Configure and Run
Configure OpenTelemetry to send traces to Tracetest using environment variables. Run the Node.js app by preloading the OpenTelemetry initialization file with -r.
export OTEL_SERVICE_NAME=my-service-name
export OTEL_EXPORTER_OTLP_PROTOCOL=http/protobuf
export OTEL_EXPORTER_OTLP_ENDPOINT="http://<tracetest-agent>:4318"
# export OTEL_EXPORTER_OTLP_HEADERS="x-tracetest-token=<token>"

node -r ./tracing.js app.js
- Install Packages
python -m pip install opentelemetry-instrumentation \
                      opentelemetry-distro \
                      opentelemetry-exporter-otlp
- Initilize Tracing
opentelemetry-bootstrap --action=install
- Configure and Run
Configure OpenTelemetry to send traces to Tracetest using environment variables. Run the Python app by using the opentelemetry-instrument module.
export OTEL_SERVICE_NAME=my-service-name
export OTEL_EXPORTER_OTLP_PROTOCOL=http/protobuf
export OTEL_EXPORTER_OTLP_ENDPOINT="http://<tracetest-agent>:4318"
# export OTEL_EXPORTER_OTLP_HEADERS="x-tracetest-token=<token>"

opentelemetry-instrument python app.py
- Install Dependencies
go get \
  github.com/gorilla/mux v1.8.1 \
  go.opentelemetry.io/contrib/instrumentation/github.com/gorilla/mux/otelmux v0.56.0 \
  go.opentelemetry.io/otel v1.31.0 \
  go.opentelemetry.io/otel/exporters/otlp/otlptrace v1.31.0 \
  go.opentelemetry.io/otel/exporters/otlp/otlptrace/otlptracehttp v1.31.0 \
  go.opentelemetry.io/otel/sdk v1.31.0 \
  go.opentelemetry.io/otel/trace v1.31.0
- Initialize Tracing
Update your main.go file.
package main

import (
	"context"
	"fmt"
	"log"
	"net/http"
	"os"

	"github.com/gorilla/mux"
	"go.opentelemetry.io/contrib/instrumentation/github.com/gorilla/mux/otelmux"
	"go.opentelemetry.io/otel"
	"go.opentelemetry.io/otel/attribute"
	"go.opentelemetry.io/otel/exporters/otlp/otlptrace"
	"go.opentelemetry.io/otel/exporters/otlp/otlptrace/otlptracehttp"
	"go.opentelemetry.io/otel/propagation"
	"go.opentelemetry.io/otel/sdk/resource"
	sdktrace "go.opentelemetry.io/otel/sdk/trace"
	semconv "go.opentelemetry.io/otel/semconv/v1.26.0"
	"go.opentelemetry.io/otel/trace"
)

var svcName = os.Getenv("OTEL_SERVICE_NAME")
var tracer trace.Tracer

func newExporter(ctx context.Context) (sdktrace.SpanExporter, error) {
	otlpTraceExporter, err := otlptrace.New(ctx, otlptracehttp.NewClient())
	if err != nil {
		log.Fatal(err)
	}

	return otlpTraceExporter, nil
}

func newTraceProvider(exp sdktrace.SpanExporter) *sdktrace.TracerProvider {
	// Ensure default SDK resources and the required service name are set.
	r, err := resource.Merge(
		resource.Default(),
		resource.NewWithAttributes(
			semconv.SchemaURL,
			semconv.ServiceNameKey.String(svcName),
		),
	)

	if err != nil {
		panic(err)
	}

	tp := sdktrace.NewTracerProvider(
		sdktrace.WithBatcher(exp),
		sdktrace.WithResource(r),
	)

	otel.SetTextMapPropagator(
		propagation.NewCompositeTextMapPropagator(
			propagation.TraceContext{},
			propagation.Baggage{},
		),
	)

	return tp
}

func homePage(w http.ResponseWriter, r *http.Request) {
	_, span := tracer.Start(r.Context(), "Homepage")
	defer span.End()

	span.SetAttributes(
		attribute.Bool("home.endpoint.hit", true),
	)

	fmt.Fprintf(w, "Welcome to the HomePage!")
	fmt.Println("Endpoint Hit: homePage")
}

func main() {
	ctx := context.Background()

	exp, err := newExporter(ctx)
	if err != nil {
		log.Fatalf("failed to initialize exporter: %v", err)
	}

	// Create a new tracer provider with a batch span processor and the given exporter.
	tp := newTraceProvider(exp)

	// Handle shutdown properly so nothing leaks.
	defer func() { _ = tp.Shutdown(ctx) }()

	otel.SetTracerProvider(tp)

	// Finally, set the tracer that can be used for this package.
	tracer = tp.Tracer(svcName)

	r := mux.NewRouter()
	r.Use(otelmux.Middleware(svcName))
	r.HandleFunc("/", homePage)
	http.Handle("/", r)

	fmt.Println("Server Started at http://localhost:8080")
	log.Fatal(http.ListenAndServe(":8080", nil))
}
- Configure and Run
Configure OpenTelemetry to send traces to Tracetest using environment variables. Run the Go app by exporting environment variables.
export OTEL_SERVICE_NAME=my-service-name
export OTEL_EXPORTER_OTLP_PROTOCOL=http/protobuf
export OTEL_EXPORTER_OTLP_ENDPOINT="http://<tracetest-agent>:4318"
# export OTEL_EXPORTER_OTLP_HEADERS="x-tracetest-token=<token>"

go run .
- Download OpenTelemetry Java Agent
curl -L -O https://github.com/open-telemetry/opentelemetry-java-instrumentation/releases/latest/download/opentelemetry-javaagent.jar
- Run with Jar and Include the OpenTelemetry Java Agent
export OTEL_SERVICE_NAME=my-service-name
export OTEL_EXPORTER_OTLP_PROTOCOL=http/protobuf
export OTEL_EXPORTER_OTLP_ENDPOINT="http://<tracetest-agent>:4318"
# export OTEL_EXPORTER_OTLP_HEADERS="x-token=<token>"

java -javaagent:opentelemetry-javaagent.jar -jar /path/to/app.jar
- Add Dependencies
dotnet add package OpenTelemetry
dotnet add package OpenTelemetry.Extensions.Hosting
dotnet add package OpenTelemetry.Exporter.OpenTelemetryProtocol
dotnet add package OpenTelemetry.Instrumentation.AspNetCore
dotnet add package OpenTelemetry.Instrumentation.Http
- Initialize Tracing
// Import OpenTelemetry SDK
using OpenTelemetry.Trace;
var builder = WebApplication.CreateBuilder(args);
builder.Services.AddControllers();
// Configure OpenTelemetry Tracing
builder.Services.AddOpenTelemetry().WithTracing(builder =>
{
  builder
      // Configure ASP.NET Core Instrumentation
      .AddAspNetCoreInstrumentation()
      // Configure HTTP Client Instrumentation
      .AddHttpClientInstrumentation()
      // Configure OpenTelemetry Protocol (OTLP) Exporter
      .AddOtlpExporter();
});
- Configure and Run
export OTEL_SERVICE_NAME=my-service-name
export OTEL_EXPORTER_OTLP_PROTOCOL=http/protobuf
export OTEL_EXPORTER_OTLP_ENDPOINT="http://<tracetest-agent>:4318"
# export OTEL_EXPORTER_OTLP_HEADERS="x-tracetest-token=<token>"

dotnet run
- Install Dependencies
gem install opentelemetry-sdk
            opentelemetry-exporter-otlp
            opentelemetry-instrumentation-all
- Initialize Tracing
require 'opentelemetry/sdk'
require 'opentelemetry/exporter/otlp'
require 'opentelemetry/instrumentation/all'

OpenTelemetry::SDK.configure do |c|
    c.use_all() # enables all instrumentation!
end
- Configure and Run
export OTEL_SERVICE_NAME=my-service-name
export OTEL_EXPORTER_OTLP_PROTOCOL=http/protobuf
export OTEL_EXPORTER_OTLP_ENDPOINT="http://<tracetest-agent>:4318"
# export OTEL_EXPORTER_OTLP_HEADERS="x-tracetest-token=<token>"

rails server -p 8080
- Install the Tracetest Web SDK
npm i @tracetest/opentelemetry-web
- Initialize Tracing
import TracetestWebSDK from "@tracetest/opentelemetry-web";

const sdk = new TracetestWebSDK({
  serviceName: "browser-app",
  endpoint: "http://<tracetest-agent>:4318/v1/traces",
});

sdk.start();
Load the instrumentation.js at the top of your browser app's header or index.js entrypoint file.
import "./instrumentation";

// rest of the app's entrypoint code
You can configure Grafana Beyla to auto-instrument Docker services and export traces to Tracetest.
- Add Beyla to your
docker-compose.yaml
services:
  autoinstrument:
    image: grafana/beyla:latest
    privileged: true
    environment:
      OTEL_EXPORTER_OTLP_ENDPOINT: "http://<tracetest-agent>:4317"
      # OTEL_EXPORTER_OTLP_HEADERS: "x-tracetest-token:<token>"
      BEYLA_OPEN_PORT: "3000,8080" # Beyla will autoinstrument services on these ports
      BEYLA_TRACE_PRINTER: "text"

# ...
- Add
pid: service:autoinstrumentto services indocker-compose.yaml
services:
  # ...

  service1:
    pid: service:autoinstrument # Add this line for Beyla to know what to instrument
    build: ./service1
    ports:
      - "3000:3000"

  service2:
    pid: service:autoinstrument # Add this line for Beyla to know what to instrument
    build: ./service2
    ports:
      - "8080:8080"
- Run Docker Compose
docker compose up
This will automatically instrument your Docker Compose services with Beyla using eBPF and send the traces to Tracetest.
- Install
cert-manager
kubectl apply -f https://github.com/cert-manager/cert-manager/releases/download/v1.11.0/cert-manager.yaml
- Install the OpenTelemetry Operator to inject automatic instrumentation in Kubernetes
Traces will be generated and collected automatically.
kubectl apply -f https://github.com/open-telemetry/opentelemetry-operator/releases/latest/download/opentelemetry-operator.yaml
- Create a file named
otel-collector.yamlfor the OpenTelemetry config
apiVersion: opentelemetry.io/v1alpha1
kind: Instrumentation
metadata:
name: otel-instrumentation
spec:
exporter:
    endpoint: http://otel-collector:4317
propagators:
    - tracecontext
    - baggage
    - b3

---
apiVersion: opentelemetry.io/v1alpha1
kind: OpenTelemetryCollector
metadata:
name: otel
spec:
config: |
  receivers:
    otlp:
      protocols:
        grpc:
        http:
  processors:
    batch:
        timeout: 100ms
  exporters:
    otlp/tracetest:
      endpoint: <tracetest-agent>:4317
      # headers:
      #   "x-tracetest-token": "<token>"
      tls:
        insecure: true
  service:
    pipelines:
        traces:
            receivers: [otlp]
            processors: [batch]
            exporters: [otlp/tracetest]
You configure 2 separate things:
- The Instrumentation, which is an init-container that will run on any pod you explictly mark (see step 5).
- The OpenTelemetry collector, which will collect the traces from the init-container and send them to Tracetest.
- Apply the
otel-collector.yamlconfig file
kubectl apply -f otel-collector.yaml
- Update any service you want to instrument
Use the following annotations as seen in the OpenTelemetry docs:
- .NET:
instrumentation.opentelemetry.io/inject-dotnet: "true" - Java:
instrumentation.opentelemetry.io/inject-java: "true" - Node.js:
instrumentation.opentelemetry.io/inject-nodejs: "true" - Python:
instrumentation.opentelemetry.io/inject-python: "true"
Add an environment variable named SERVICE_NAME to your service so that you can
later identify it in the tests.
apiVersion: apps/v1
kind: Deployment
metadata:
name: your-service
spec:
replicas: 1
template:
  annotations:
    instrumentation.opentelemetry.io/inject-nodejs: 'true'
spec:
    containers:
      var:
        - name: SERVICE_NAME
          value: 'your-service'
This will automatically instrument your service with OpenTelemetry and send the traces to the OpenTelemetry collector.
You can configure OpenTelemetry SDKs to export traces to an OpenTelemetry Collector first. Then, configure an exporter and service pipeline to forward traces to Tracetest.
- Configure Exporters
exporters:
  # This is the exporter that will send traces to Tracetest
  otlp/tracetest:
    endpoint: http://<tracetest-agent>:4317
    # headers:
    #   "x-tracetest-token": "<token>"
    tls:
      insecure: true
- Add a Service Pipeline
service:
  pipelines:
    # You most likely have a traces pipeline. You don't have to change it.
    # Add this one to your configuration. Make sure to not have two
    # pipelines with the same name.
    traces/tracetest:
      receivers: [otlp] # your receiver
      processors: [batch]
      exporters: [otlp/tracetest] # your exporter pointing to the Tracetest OTLP endpoint