Testkube Kubernetes-native Test Runner Pipeline
Running Scheduled Trace-based Tests
Tracetest is a testing tool based on OpenTelemetry that allows you to test your distributed application. It uses data from distributed traces generated by OpenTelemetry to validate and assert if your application has the desired behavior described by your test definitions.
Testkube is a Kubernetes-native testing framework for Testers and Developers that allows you to automate the executions of your existing testing tools inside your Kubernetes cluster, removing all the complexity from your CI/CD/GitOps pipelines.
By using the Testkube Tracetest Executor you can unlock Testkube's capacity in conjunction with Tracetest, and leverage the work you have already done to instrument your services.
Why do we want to run Tracetest with Testkube?
Tracetest leverages existing OpenTelemetry instrumentation to run assertions against every part of a distributed transaction.
By integrating with Testkube you can now add Tracetest to the native CI/CD pipeline in your Kubernetes cluster. It allows you to run scheduled tests and synthetic tests. All while following the trace-based testing principle and enabling full in-depth assertions against trace data, not just the response.
Infrastructure Overview
The following is high level sequence diagram on how Testkube and Tracetest interact with the different pieces of the system:
Quickstart
This guide will show how to use Testkube alongside Tracetest to run scheduled Trace-based tests in a Kubernetes cluster.
Prerequisites
Tracetest account:
- Sign up to
app.tracetest.ioor follow the get started docs. - Create an organization and environment.
- Deploy the Tracetest Agent in your cluster.
- Create an environment token.
Testkube account:
- Sign up to
app.testkube.ioor follow the get started docs. - Create a Testkube environment.
- Deploy the Testkube Agent in your cluster.
Remember, in your Kubernetes cluster you should have:
Tracetest Agent.Testkube Agent.OpenTelemetry Instrumented Service: In order to generate traces and spans, the service under test must support the basics for propagation through HTTP requests, and also store traces and spans into a Tracing Backend (Jaeger, Grafana Tempo, OpenSearch, etc) or use the OpenTelemetry Collector. If you are using a Tracing Backend, the Tracetest Agent requires network access to it. In case of using the OpenTelemetry Collector, you need to setup your collector to send trace data to the Tracetest Agent.
On your machine you should have:
With everything set up, we will start configuring Testkube and Tracetest to run scheduled Trace-based tests.
1. Connect your Testkube CLI to your Testkube Environment
To use the Testkube CLI with your Testkube account you need to set the CLI Context. For that you need a Testkube Pro token. When the token is created, you are ready to change the Testkube CLI context:
testkube set context -c cloud -e testkube-environment-id -o testkube-organization-id -k testkube-token
For more information see the Testkube Connecting from the CLI docs.
2. Create a Test in Tracetest
In the environment in your Tracetest account, start by clicking Tests > Create > HTTP, then Enter the URL of your OpenTelemetry Instrumented Service and click Run. Remember that you need the Tracetest Agent deployed and configured in your environment so it can trigger the request and fetch the trace data.
This will trigger the test and display the distributed trace in the Test tab to run assertions against.
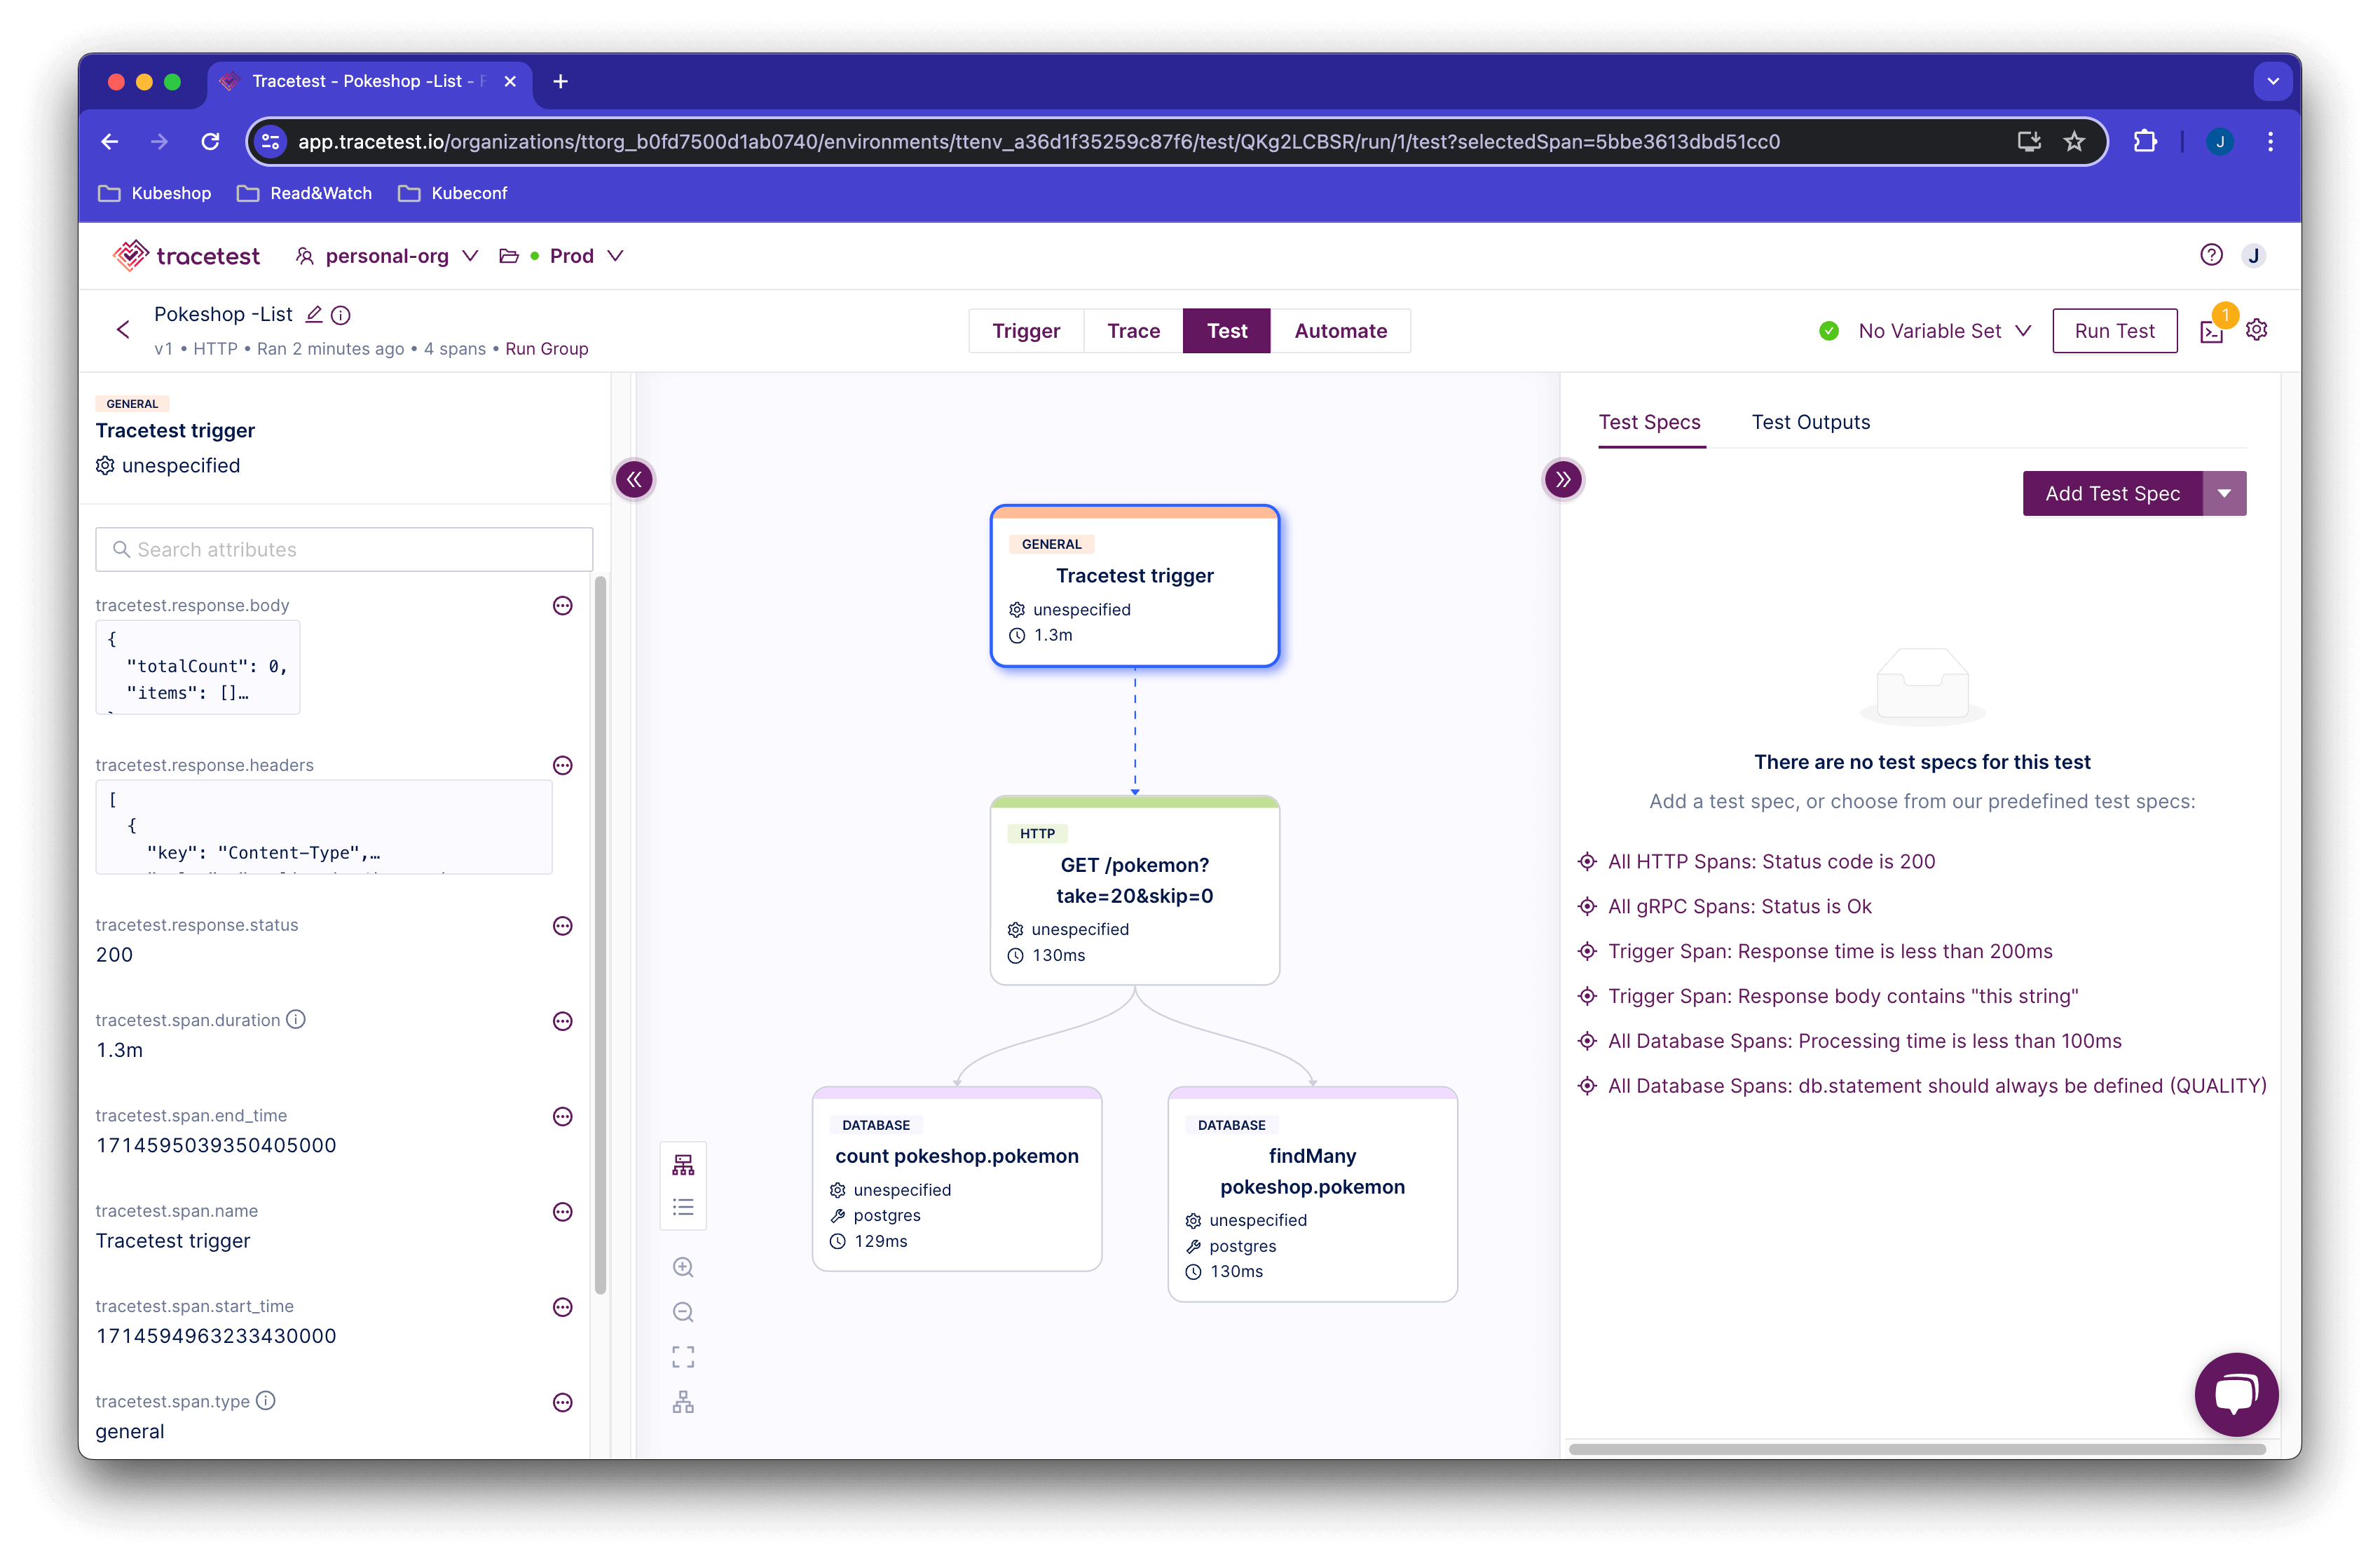
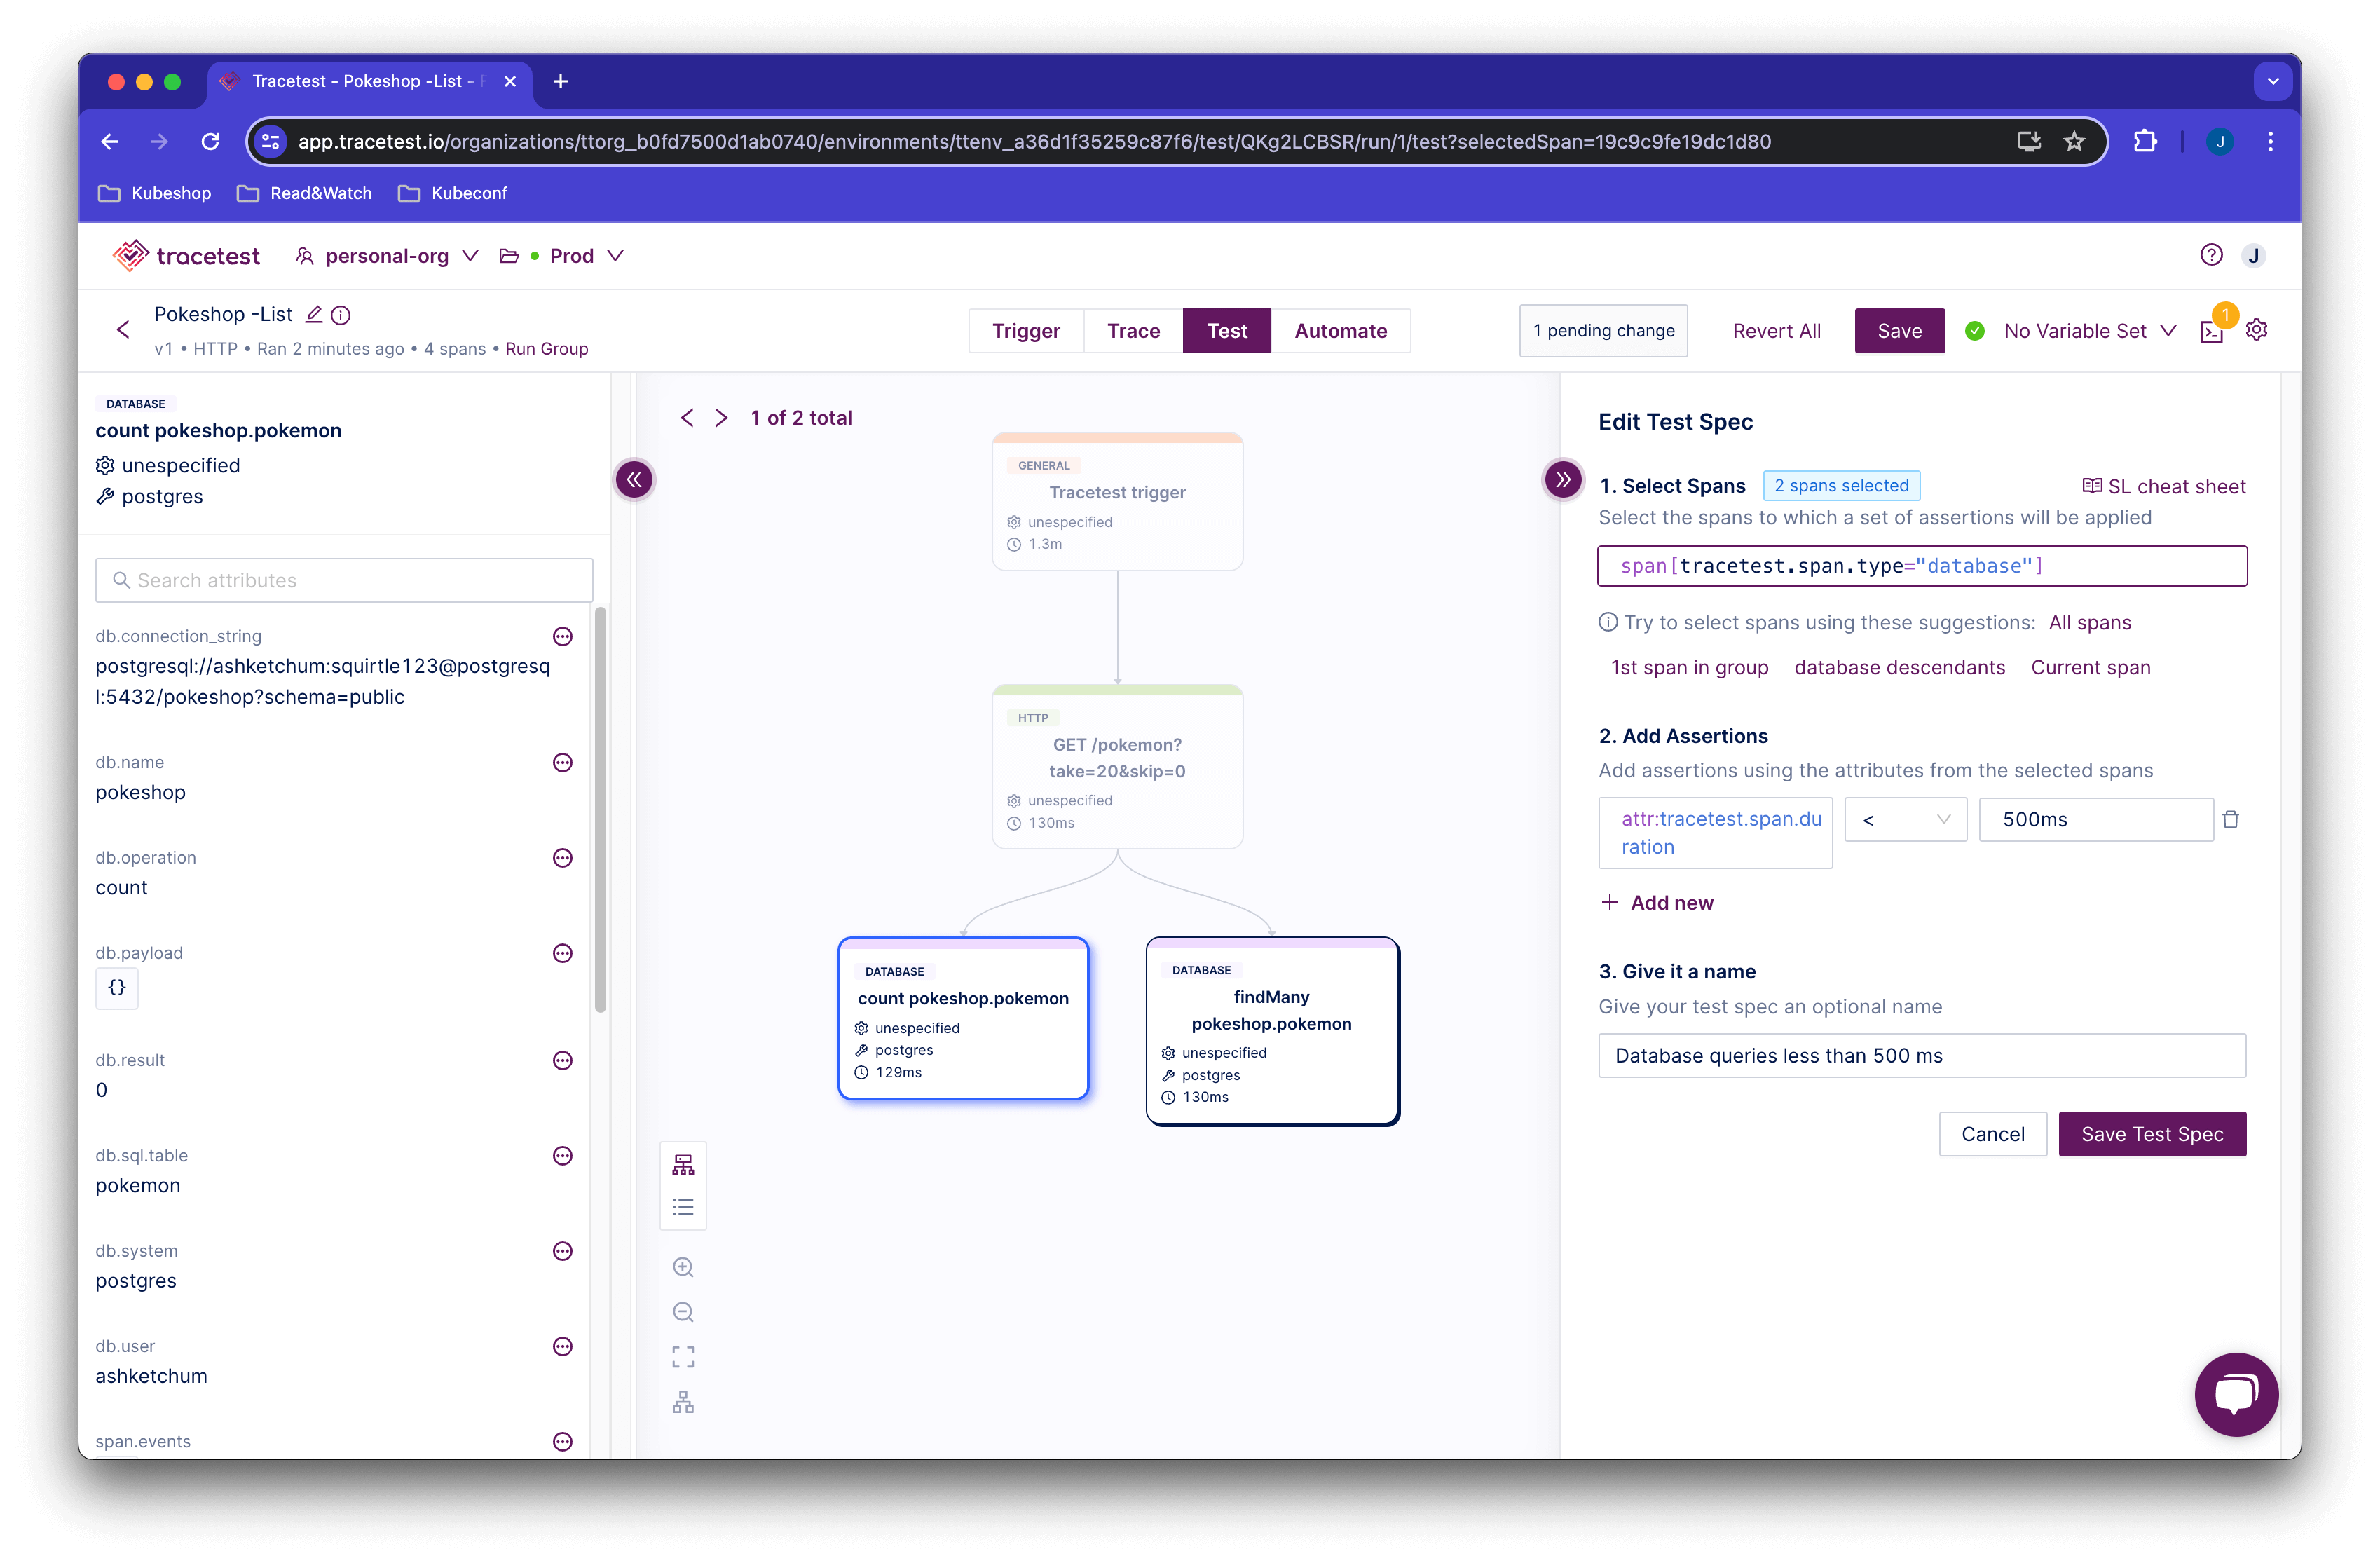
Proceed to add a test spec to assert all database queries return within 500 ms. Click the Test tab and proceed to click the Add Test Spec button.
In the span selector make sure to add this selector:
span[tracetest.span.type="database"]
In the assertion field add:
attr: tracetest.span.duration < 500ms;
Save the test spec and publish the test.
The database spans that are returning in less than 500ms are labeled in green.
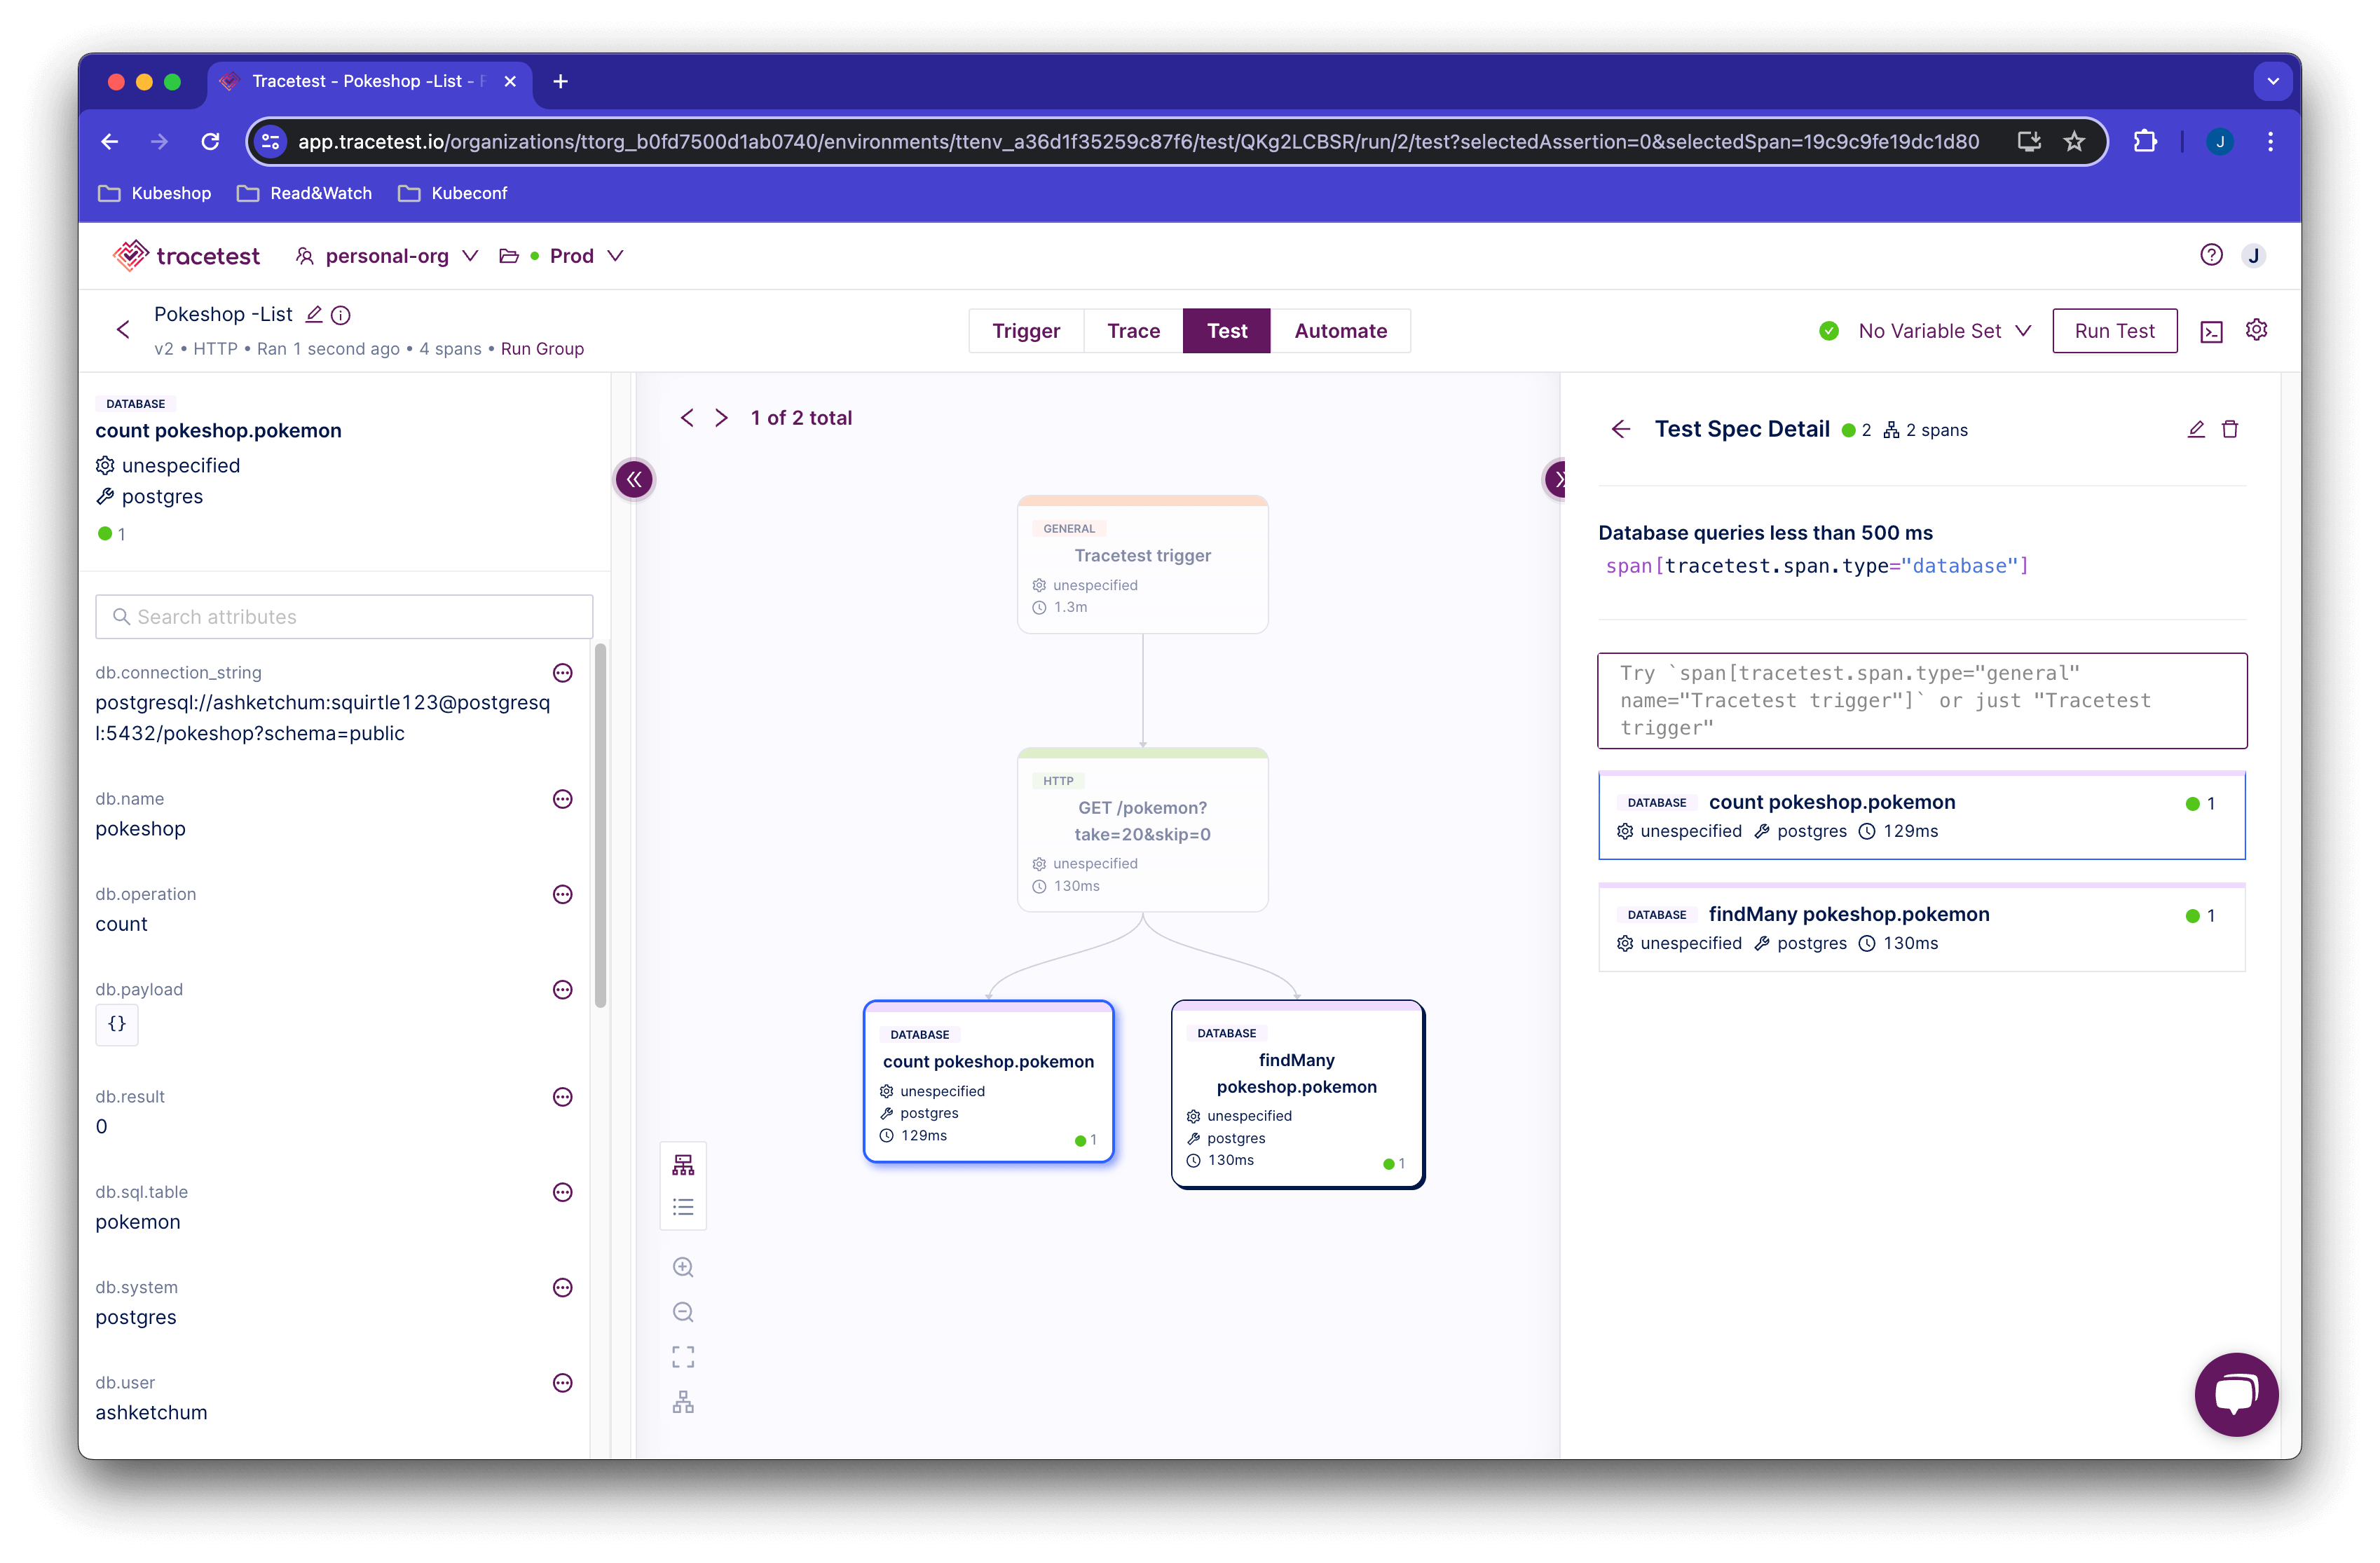
This is an example of a trace-based test that asserts against every single part of an HTTP transaction, including all interactions with the database.
However, Tracetest cannot run this test as part of your CI/CD without integrating with another tool.
Let's introduce how Testkube makes it possible.
3. Create a Trace-based Test with Tracetest in Testkube
Click the Automate tab in the top of your screen. This will show the YAML definition for the test run.
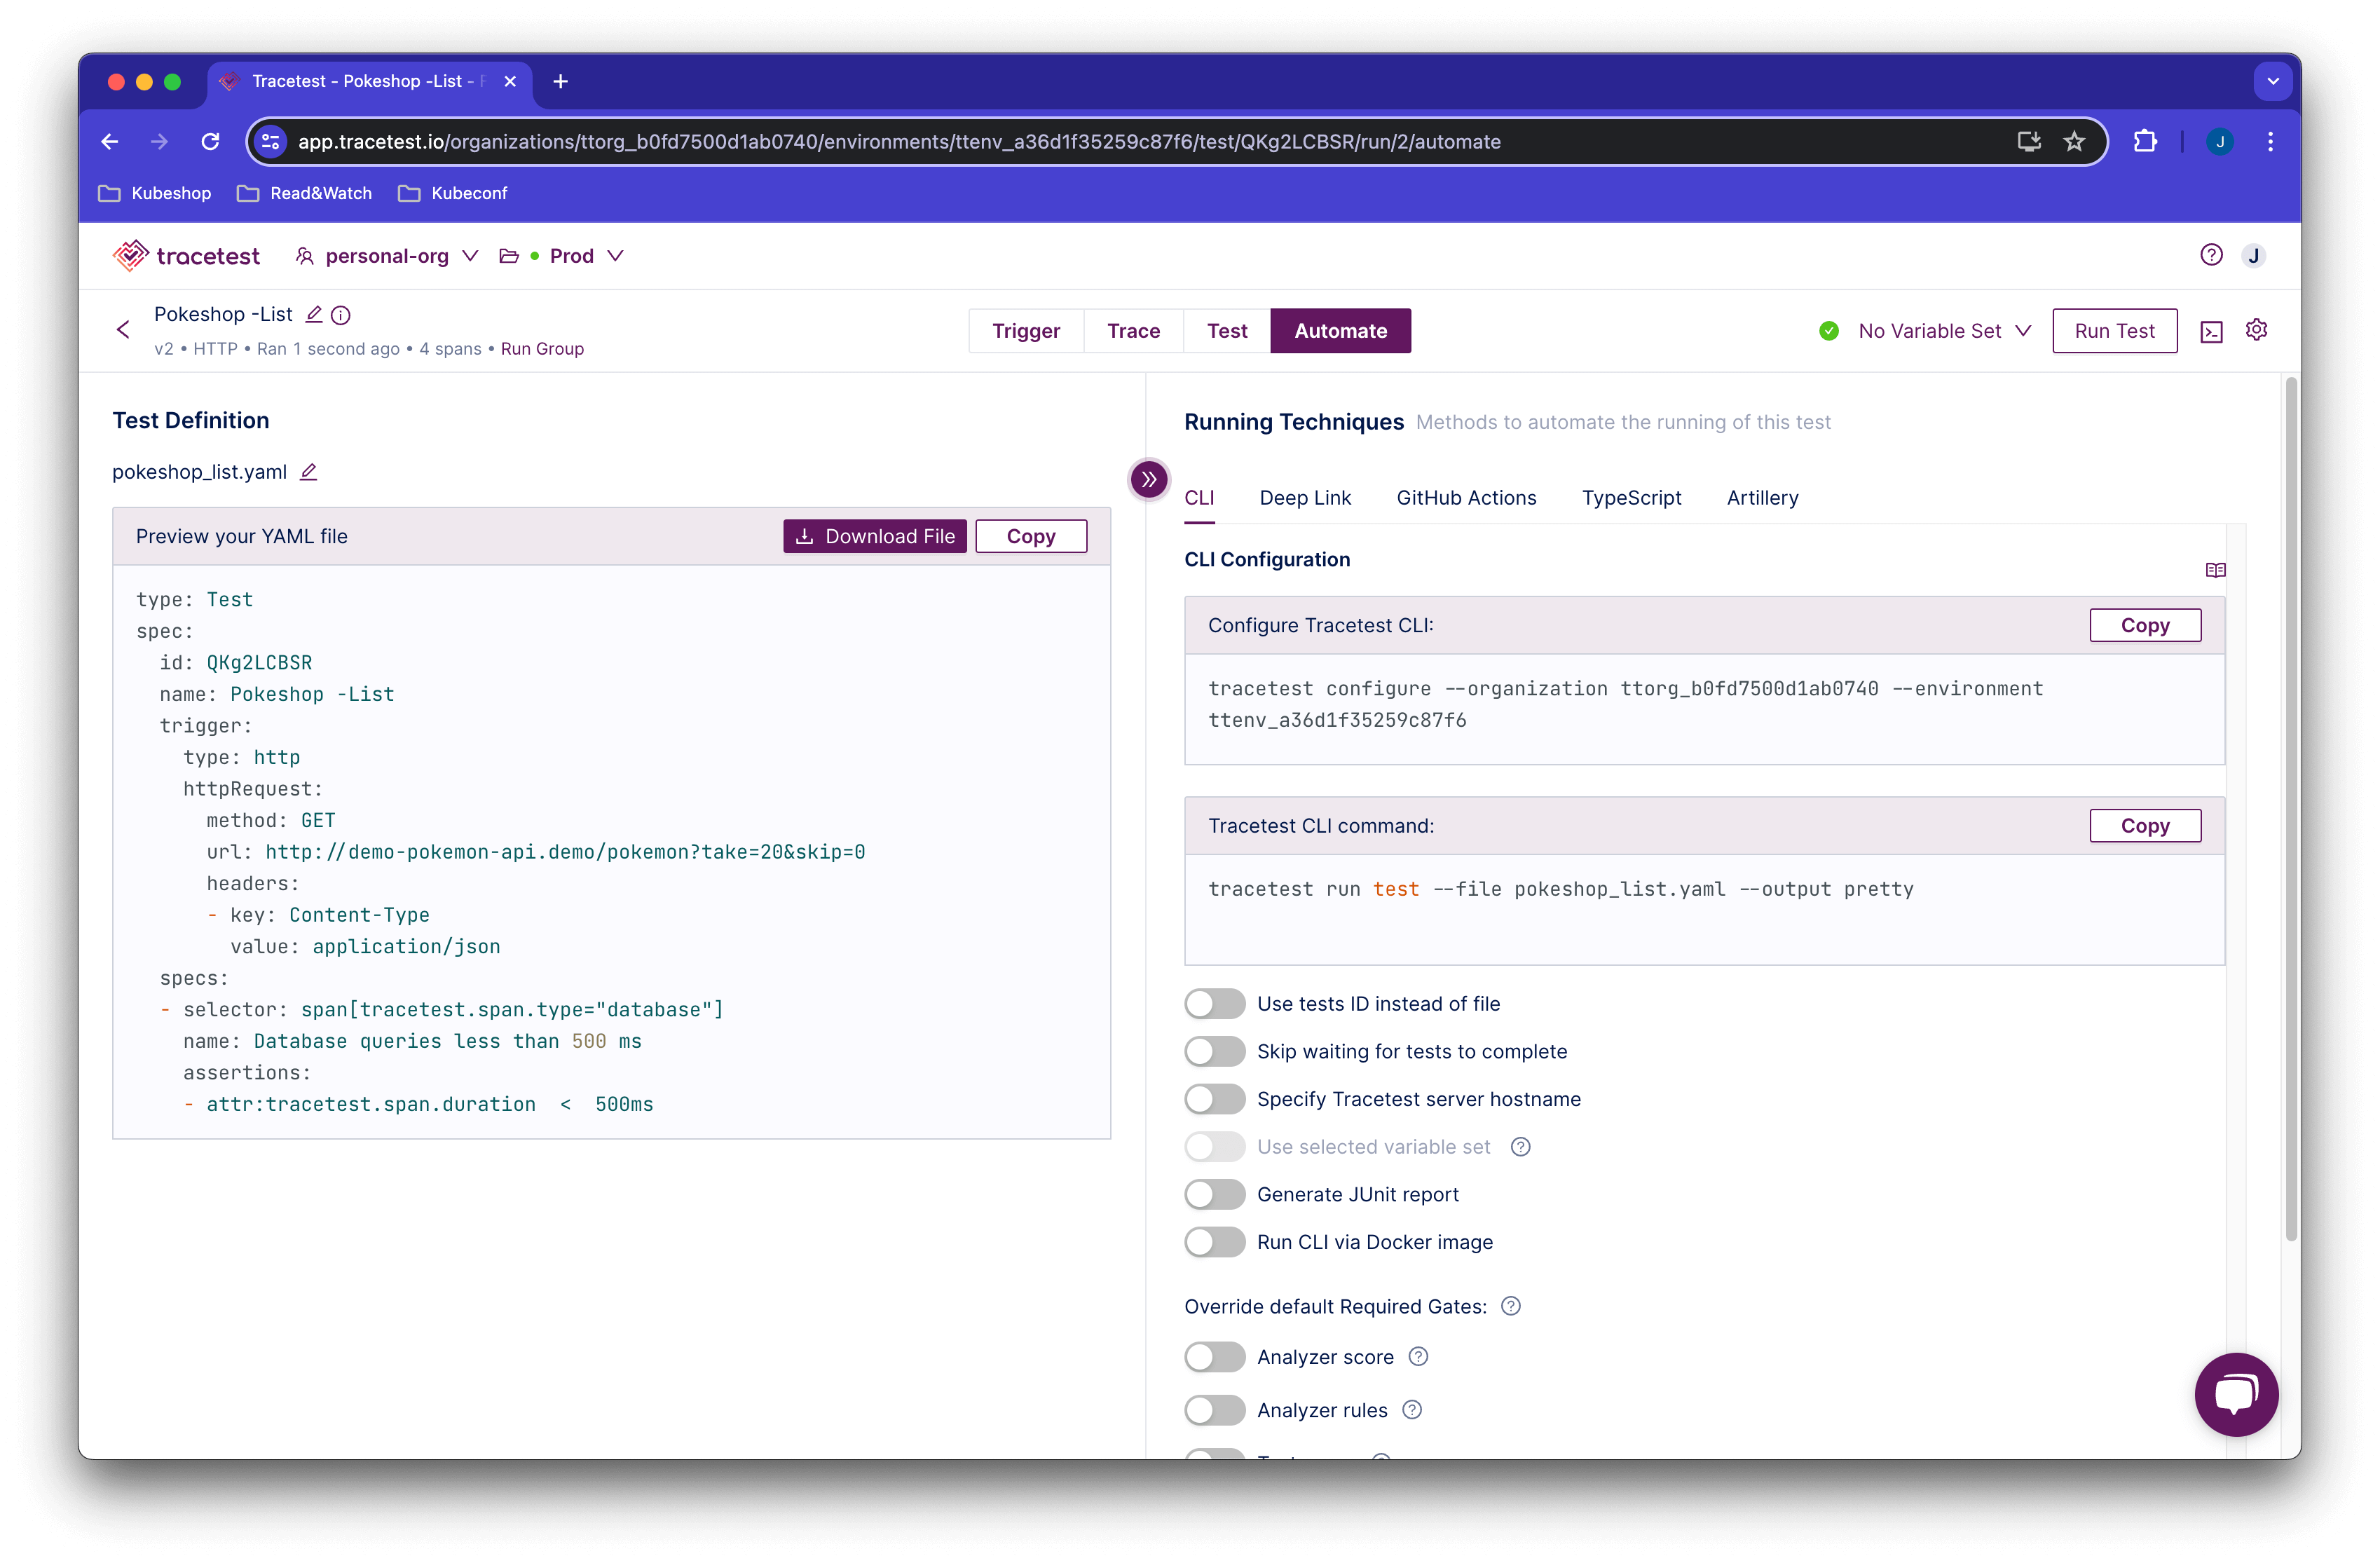
Click the Download File button and this will save your definition in a yaml format.
type: Test
spec:
  id: RUkKQ_aVR
  name: Pokeshop - List
  description: Get a Pokemon
  trigger:
    type: http
    httpRequest:
      url: http://demo-pokemon-api.demo/pokemon?take=20&skip=0
      method: GET
      headers:
        - key: Content-Type
          value: application/json
  specs:
    - name: Database queries less than 500 ms
      selector: span[tracetest.span.type="database"]
      assertions:
        - attr:tracetest.span.duration  <  500ms
Execute the following command to create the test executor object in Testkube. Do not forget to provide the path to your Tracetest definition file using the --file argument, and also the following variables:
TRACETEST_TOKEN: your environment token.TRACETEST_ENVIRONMENT: your environment id.TRACETEST_ORGANIZATION: your organization id.
kubectl testkube create test --file my/file/location.yaml --type "tracetest/test" --name pokeshop-tracetest-test --variable TRACETEST_TOKEN=tracetest-token --variable TRACETEST_ENVIRONMENT=tracetest-environment-id --variable TRACETEST_ORGANIZATION=tracetest-organization-id
Test created testkube / pokeshop-tracetest-test 🥇
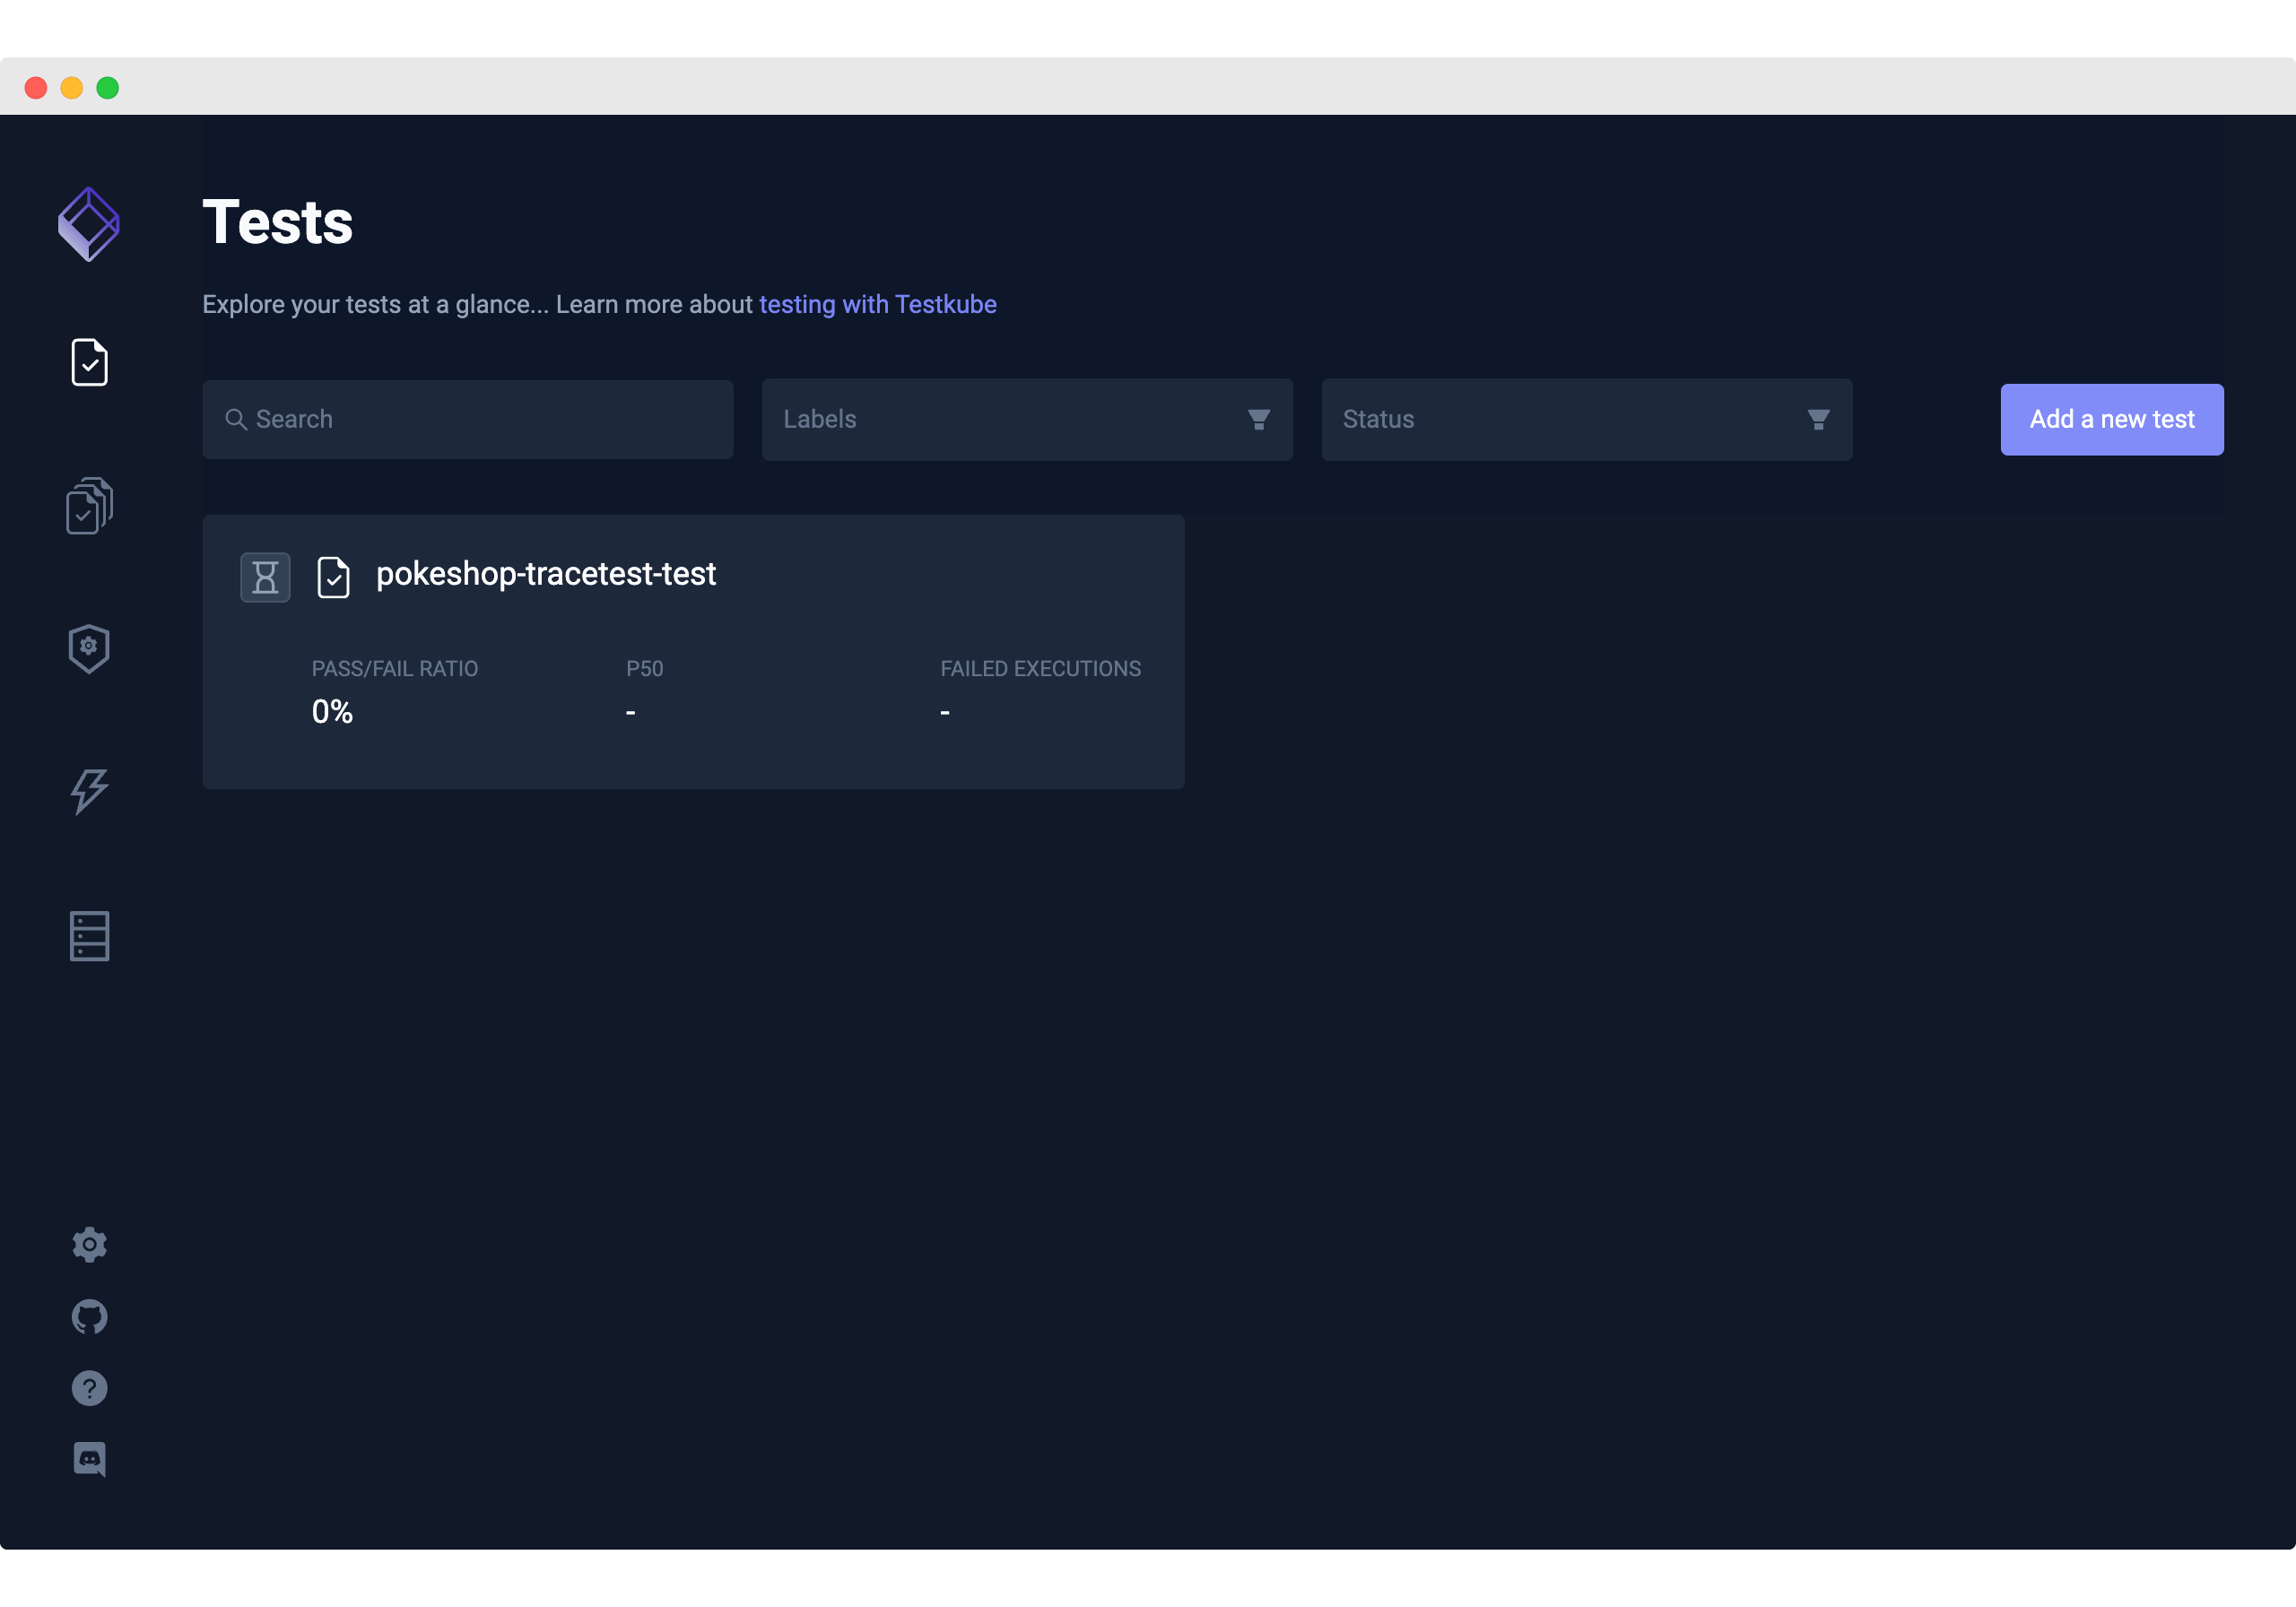
Opening the Testkube Dashboard will show the test is created successfully.
4. Run the Tracetest Trace-based Test in Testkube
Finally, to run the test, execute the following command, or run the test from the Testkube Dashboard.
kubectl testkube run test --watch pokeshop-tracetest-test
Here's what the Testkube CLI will look like if the test passes.
🚚 [TracetestRunner]: Preparing test run
🌍 Configuring Tracetest CLI with Token
🌍 Using arguments to configure CLI: [configure --token tracetest-token --organization tracetest-organization-id --environment tracetest-environment-id]
🚀 Configure command tracetest configure --token tracetest-token --organization tracetest-organization-id --environment tracetest-environment-id
🔬 Executing in directory :
 $ tracetest configure --token tracetest-token --organization tracetest-organization-id --environment tracetest-environment-id
 SUCCESS  Successfully configured Tracetest CLI

✅ Execution succeeded
🌍 Using arguments to run test: [run test --file /data/test-content --output pretty]
🚀 Test run command tracetest run test --file /data/test-content --output pretty
🔬 Executing in directory :
 $ tracetest run test --file /data/test-content --output pretty

✔ RunGroup: #58WmDuBSR (https://app.tracetest.io/organizations/tracetest-organization-id/environments/tracetest-environment-id/run/58WmDuBSR)
 Summary: 1 passed, 0 failed, 0 pending
  ✔ Pokeshop - List (https://app.tracetest.io/organizations/tracetest-organization-id/environments/tracetest-environment-id/test/R5NITR14g/run/1/test) - trace id: 3cdcb56d6c226f7083f45d6b3d278051
	✔ span[tracetest.span.type="http"]
	✔ span[tracetest.span.type="database"]
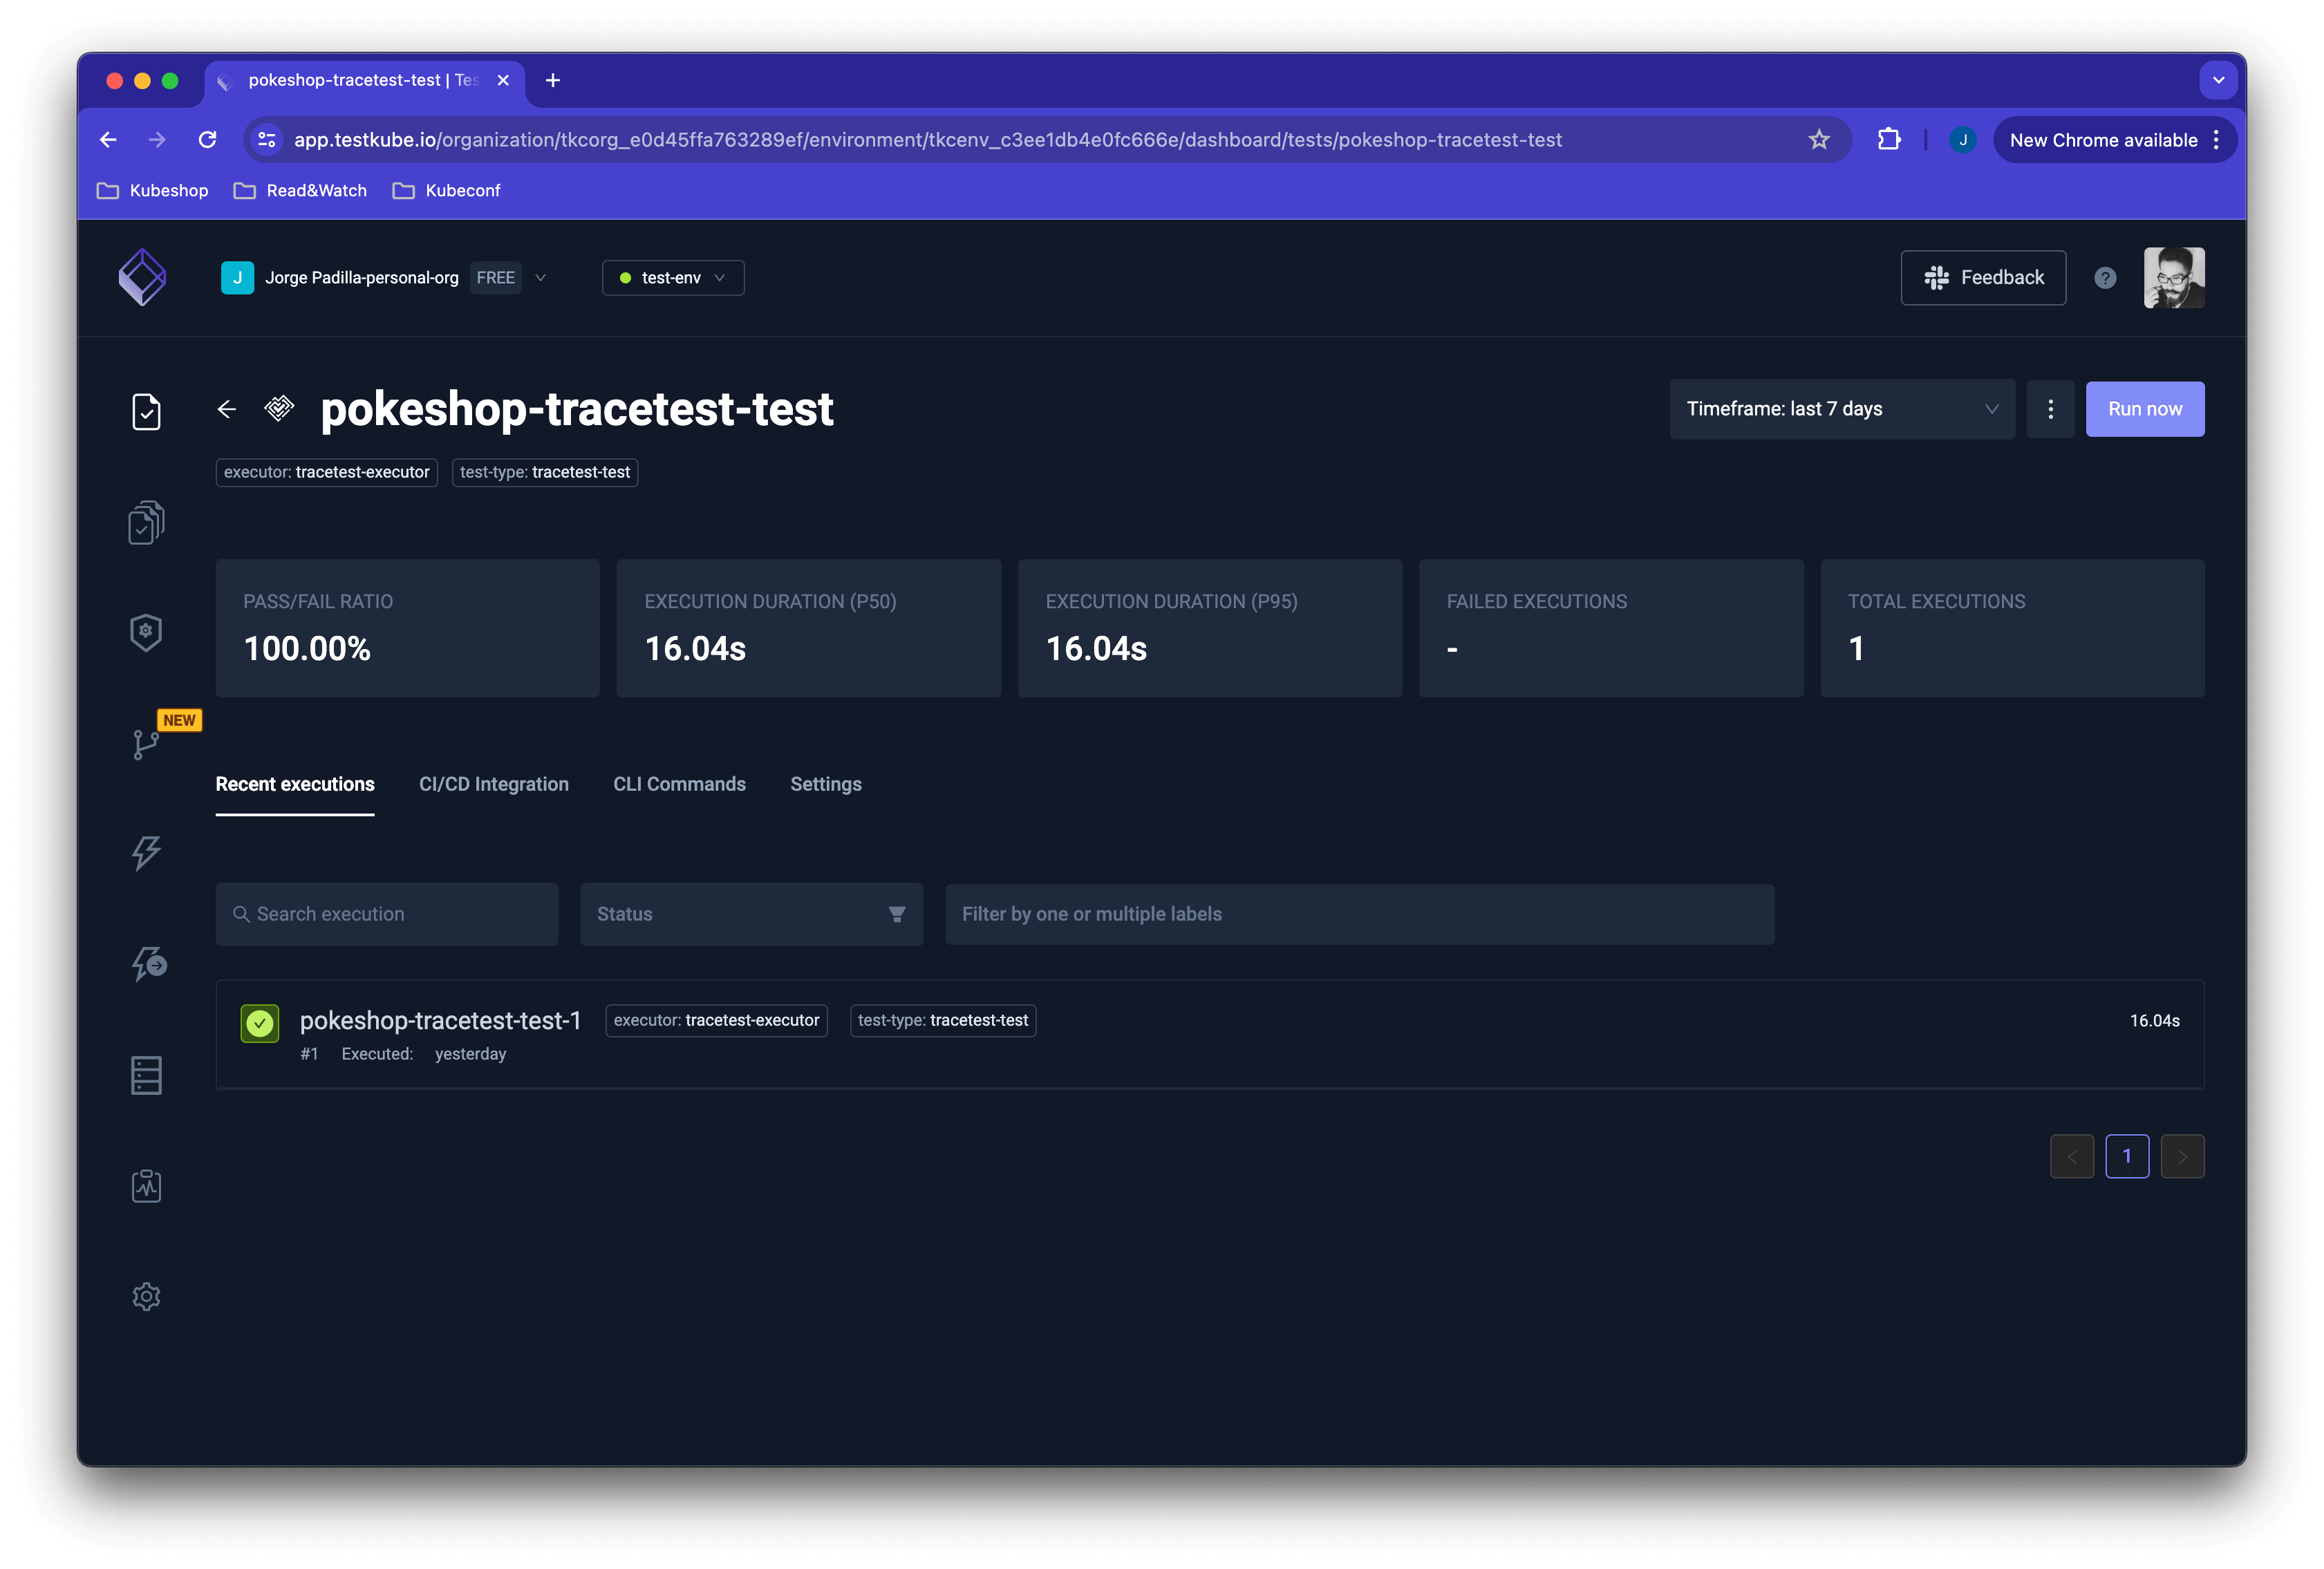
And, here's the Testkube Dashboard.
5. Create a Trace-based Test That Runs Every Minute
By using Testkube's scheduling, you can trigger this test every minute.
kubectl testkube create test --file my/file/location.yaml --type "tracetest/test" --name pokeshop-tracetest-scheduled-test --schedule="*/1 * * * *" --variable TRACETEST_TOKEN=tracetest-token --variable TRACETEST_ENVIRONMENT=tracetest-environment-id --variable TRACETEST_ORGANIZATION=tracetest-organization-id
Test created testkube / pokeshop-tracetest-scheduled-test 🥇
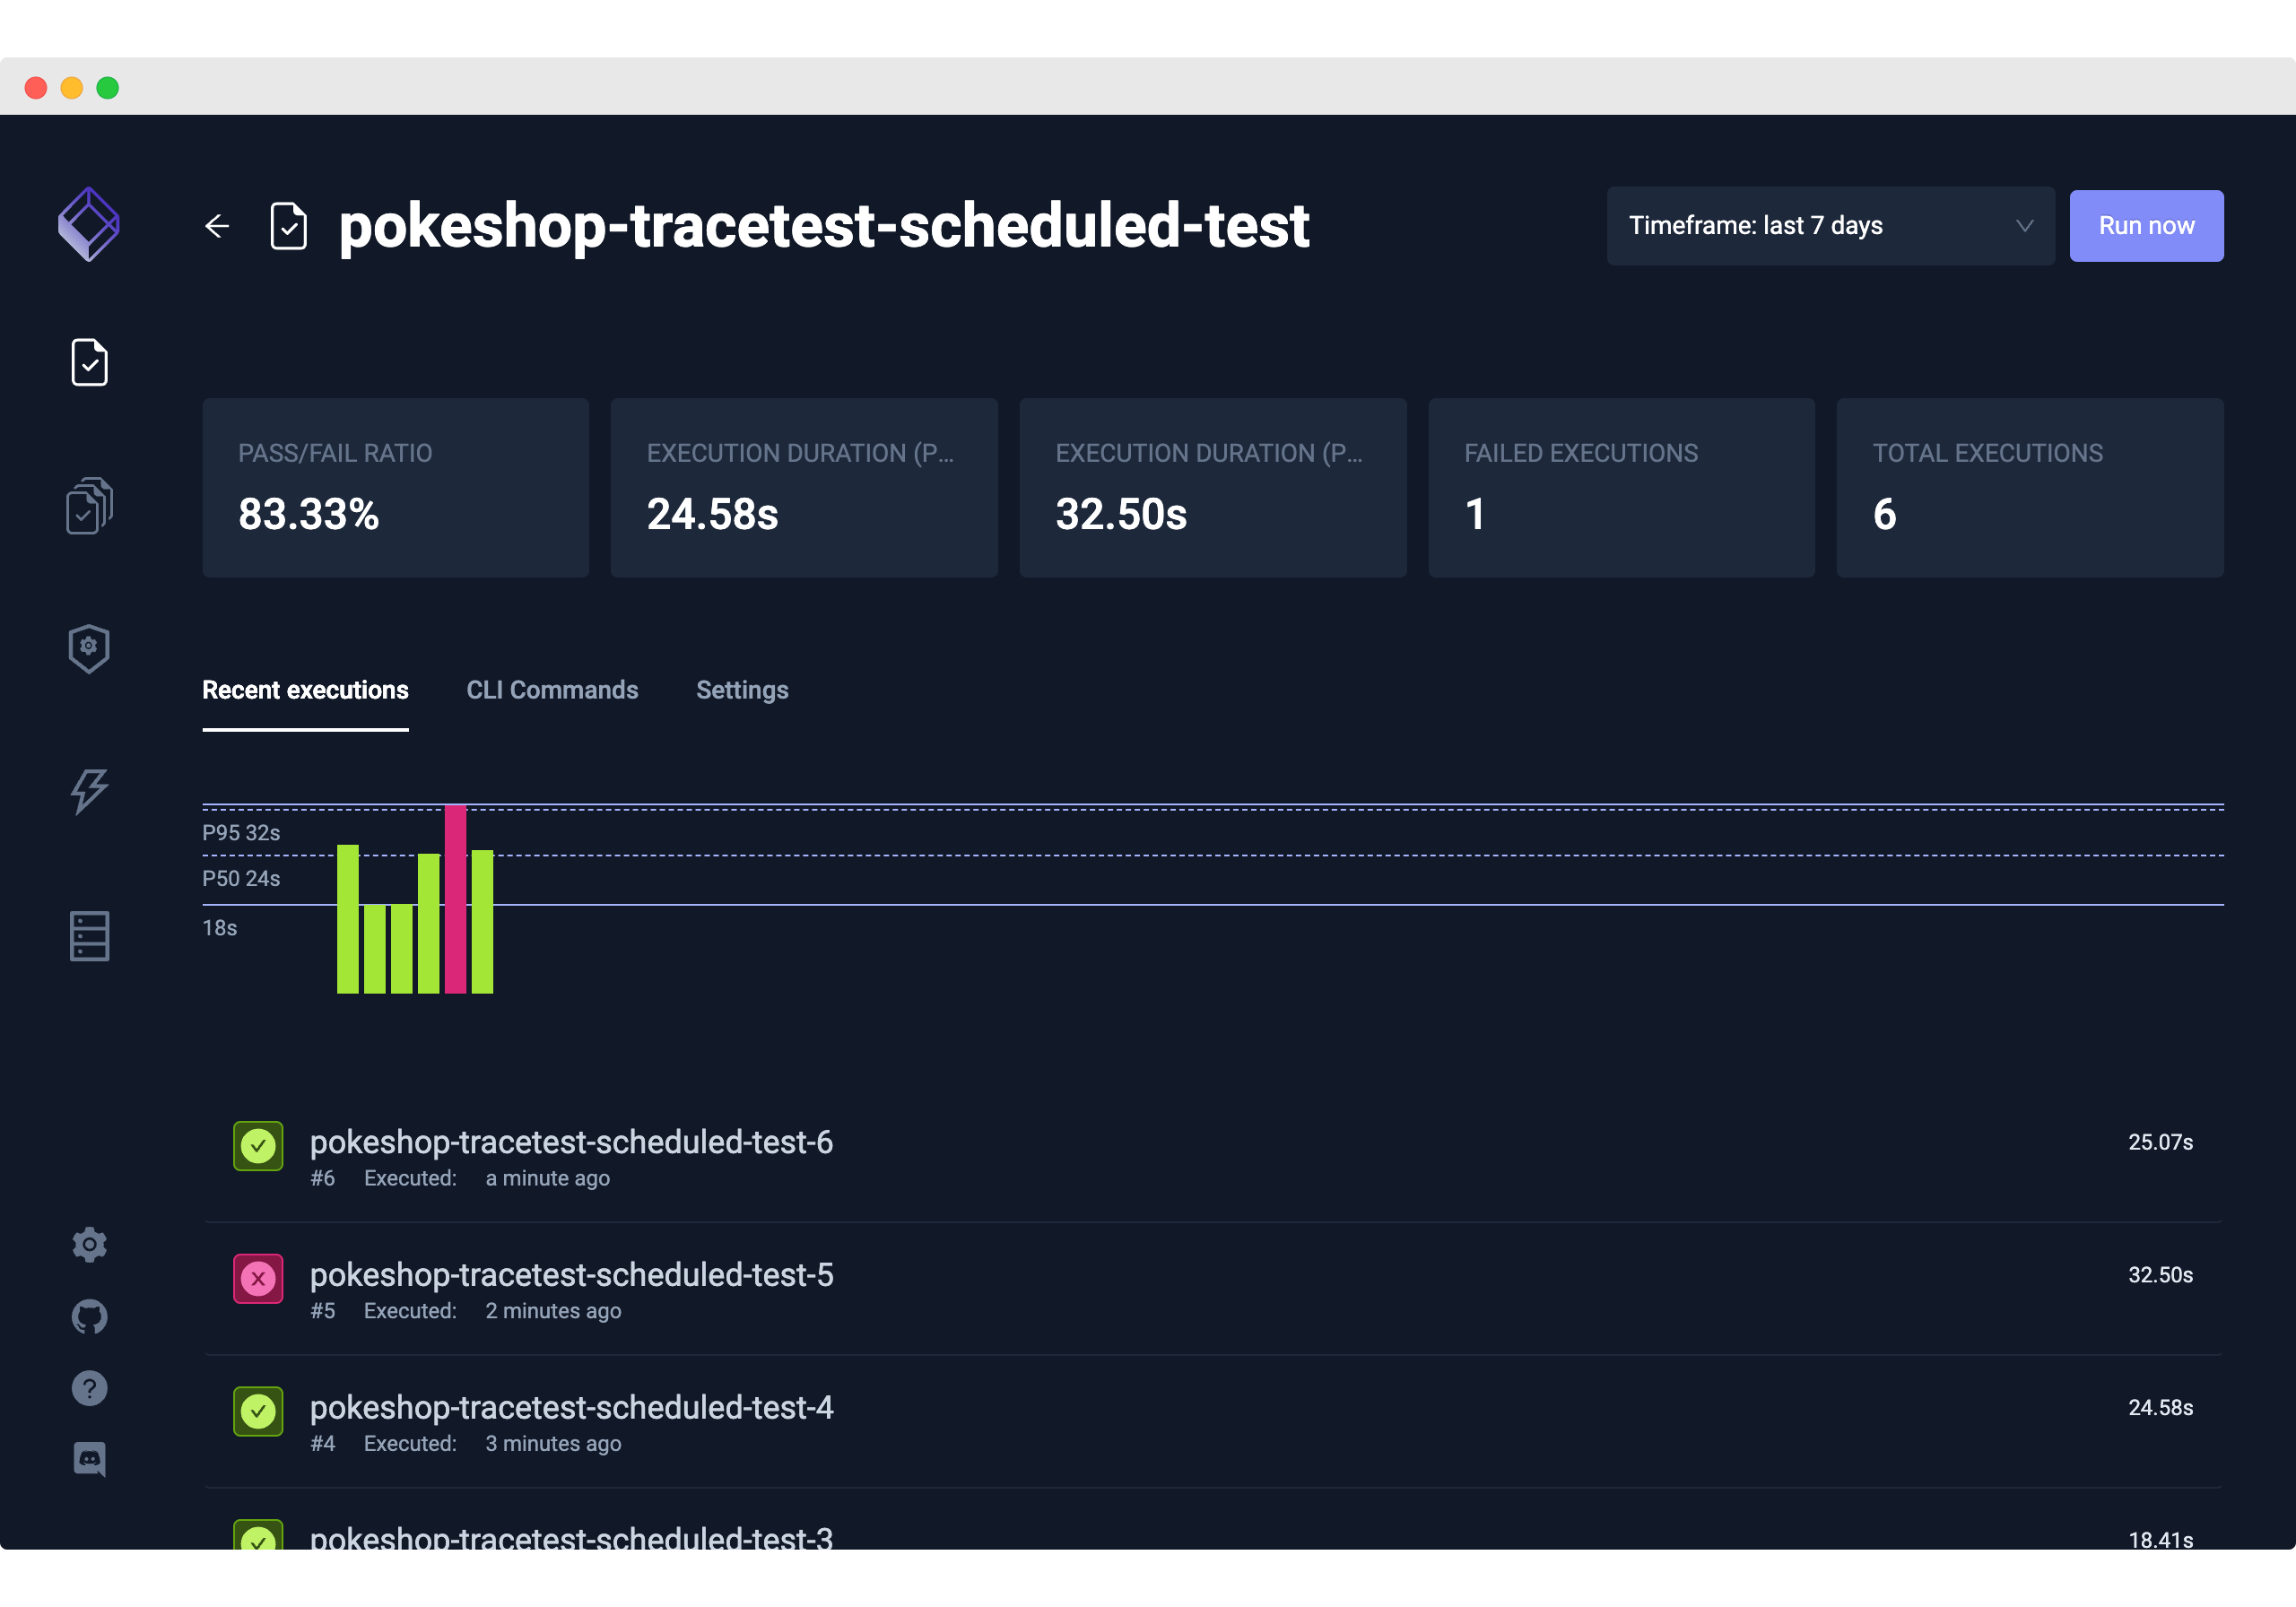
In your Testkube Dashboard you'll see this test run continuously and get triggered every minute.
What's Next?
To explore more options that Testkube gives you, check out test triggers. They enable you to trigger tests based on Kubernetes events.
Learn More
Please visit our documentation and join our Slack Community for more info!