Github Actions Pipeline with Secrets
Tracetest is a testing tool based on OpenTelemetry that allows you to test your distributed application. It allows you to use data from distributed traces generated by OpenTelemetry to validate and assert if your application has the desired behavior defined by your test definitions.
Github Actions is a continuous integration/continuous deployment (CI/CD) automation service provided by GitHub. It allows developers to automate their software workflows directly in their GitHub repositories. These workflows can include building, testing, and deploying applications, as well as many other tasks. Workflows are defined using YAML files and can be triggered by various GitHub events such as push, pull requests, or issue comments.
Running trace-based test in Github Actions with Secrets
When creating CI test scripts in GitHub, you sometimes need to use sensitive information, like passwords and API Keys. To keep this information safe, GitHub provides a feature called Secrets. Secrets are encrypted environment variables that you create in a repository and are available to use in your workflows.
In this example, you will see how to configure a repository to use Tracetest and Github Actions with Secrets to run trace-based tests, keeping your sensitive information safe.
Let's start by using a mini Payment ecosystem with 4 APIs that work together to emulate a Payment system.
- Gateway API: User-facing API that receives payment orders, protected with Basic Auth.
- Payment Executor API: Executes a payment order after analyzing the customer profile.
- Risk Analysis API: Analyzes a user profile to understand its score.
- Wallet API: Retains data about the Wallet balance of each user.
These APIs are instrumented with OpenTelemetry SDKs and send data to Jaeger via the OpenTelemetry Collector.
Each one of these APIs has their code specified inside our source code on GitHub (here) inside the services folder.
You can run them together using Docker Compose along with a Tracetest Agent, that we will use soon to test these services, with the following command:
git clone git@github.com:kubeshop/tracetest.git
cd ./tracetest/examples/tracetest-with-github-action-and-secrets
TRACETEST_API_KEY=<your-agent-key> docker compose up
To run a test, you need execute an API call against the Gateway API. It's protected with Basic Auth.
In this tutorial, you will use a Github Secret to store the Basic Auth credentials and use it in our Github Action workflow by adding it to a VariableSet as a secret.
Creating a GitHub Actions Workflow
To test this recipe, create a repository in your machine, add it to GitHub, and run the workflow.
Creating the API Services GitHub Repo
First of all, you need to create a new folder on your machine to store the service code and the repository code. You can do this by running the following commands:
# sandbox folder to store our files
mkdir github-actions-test
cd ./github-actions-test

mkdir my-repository
cd ./my-repository
Now copy the code of the Payment Ecosystem to this repository. You can do this by running the following commands:
cd ..

git clone git@github.com:kubeshop/tracetest.git
cp -r ./tracetest/examples/tracetest-with-github-action-and-secrets/services ./my-repository

cd ./my-repository

# remove the .git folder to start a new repository
rm -rf .git
git init

git add .
git commit -m "Initial commit"
Then, create a new repository on GitHub and perform the commands below:
Remember to replace <your-github-user> and <your-github-name> with your Github user and the name of the repository you created.
git remote add origin https://github.com/<your-github-user>/<your-github-name>.git
git push origin main
After that, you need to configure a new environment on Tracetest with these instructions and generate an environment token for it (here). Remember to store the API Key generated for the Tracetest Agent and the environment token as they will be used on next step.
You need to register three secrets in your GitHub repository using these instructions:
TRACETEST_API_KEY: that is the API key used by your agent to connect to TracetestTRACETEST_CLI_TOKEN: an environment token used by the CI to run a testAPI_SECRET_PASSWORD: the password used to authenticate on the Gateway API. For demo purposes, its value issupersecret.
Creating the GitHub Actions Workflow
Now that you have the repository set, let's create a new Github Actions workflow file in your repository. First, create a new file in the .github/workflows folder with the following content:
name: Run trace-based tests

on:
  # runs on every push to main
  push:
    branches: [main]

  # allows run manually via Actions tab on Github
  workflow_dispatch:

env:
  TRACETEST_API_KEY: ${{secrets.TRACETEST_API_KEY}}

jobs:
  run-trace-based-tests:
    name: Run trace based tests for Payment Ecosystem
    runs-on: ubuntu-latest

    steps:
      - name: Checkout
        uses: actions/checkout@v3

      # more steps to add
This file defines a workflow that runs on every push to the main branch and can be manually triggered via the Actions tab on GitHub. It also defines an environment variable TRACETEST_API_KEY that is set to the value of the secret TRACETEST_API_KEY. This value will be used by the Tracetest Agent defined inside our docker-compose.yml file. The file also adds the first step that checks out the repository code into the CI container.
The next step that you will add is to install the Tracetest CLI in the CI container with the Tracetest Github Action and configure the CLI. You can do this by adding the following step:
# ...
    steps:
      # previous steps ...

      - name: Configure Tracetest CLI
        uses: kubeshop/tracetest-github-action@v1
        with:
          token: ${{secrets.TRACETEST_CLI_TOKEN}}

      # more steps to add
Then, the two following steps will start the APIs locally using Docker Compose and configure Tracetest Agent to read traces from the Jaeger instance running inside of the Docker Compose network:
# ...
    steps:
      # previous steps ...

      - name: Run APIs locally with docker compose
        run: |
          docker-compose up -d
          docker compose logs -f > /tmp/docker-log &

      - name: Configure Tracing Backend
        run: |
          tracetest datastore apply --file ./tracing-backend.yaml

      # more steps to add
Now, you will set up a VariableSet with the id tracetesting-vars that will have all variables used in your test context, including the API_SECRET_PASSWORD secret. This will make Tracetest understand that this variable is a secret and should not be presented on the UI and CLI outputs. You can do this by adding the following step to the workflow file:
# ...
    steps:
      # previous steps ...

      - name: Inject secrets as a variable set in Tracetest
        run: |
          cat << EOF > vars.yaml
          type: VariableSet
          spec:
            id: tracetesting-vars
            name: AuthKeys for test
            description: Variables used in basic auth for my API
            values:
            - key: USER
              value: admin
            - key: PASSWORD
              value: ${{secrets.API_SECRET_PASSWORD}}
              type: secret
          EOF

          tracetest apply variableset --file ./vars.yaml

      # more steps to add
Finally, you will run the test using the Tracetest CLI, passing the tracetesting-vars Variable Set with the --vars argument and the test file trace-based-test.yaml that contains the test definition. You can do this by adding the following step to the workflow file:
# ...
    steps:
      # previous steps ...

      - name: Run trace-based tests
        run: |
          tracetest run test --vars tracetesting-vars --file ./trace-based-test.yaml

      # more steps to add
You can run the test by pushing a new commit to the main branch with:
# assuming that you are on "my-repository" folder

git add .
git commit -m "Add Tracetest Github Action workflow"
git push origin main
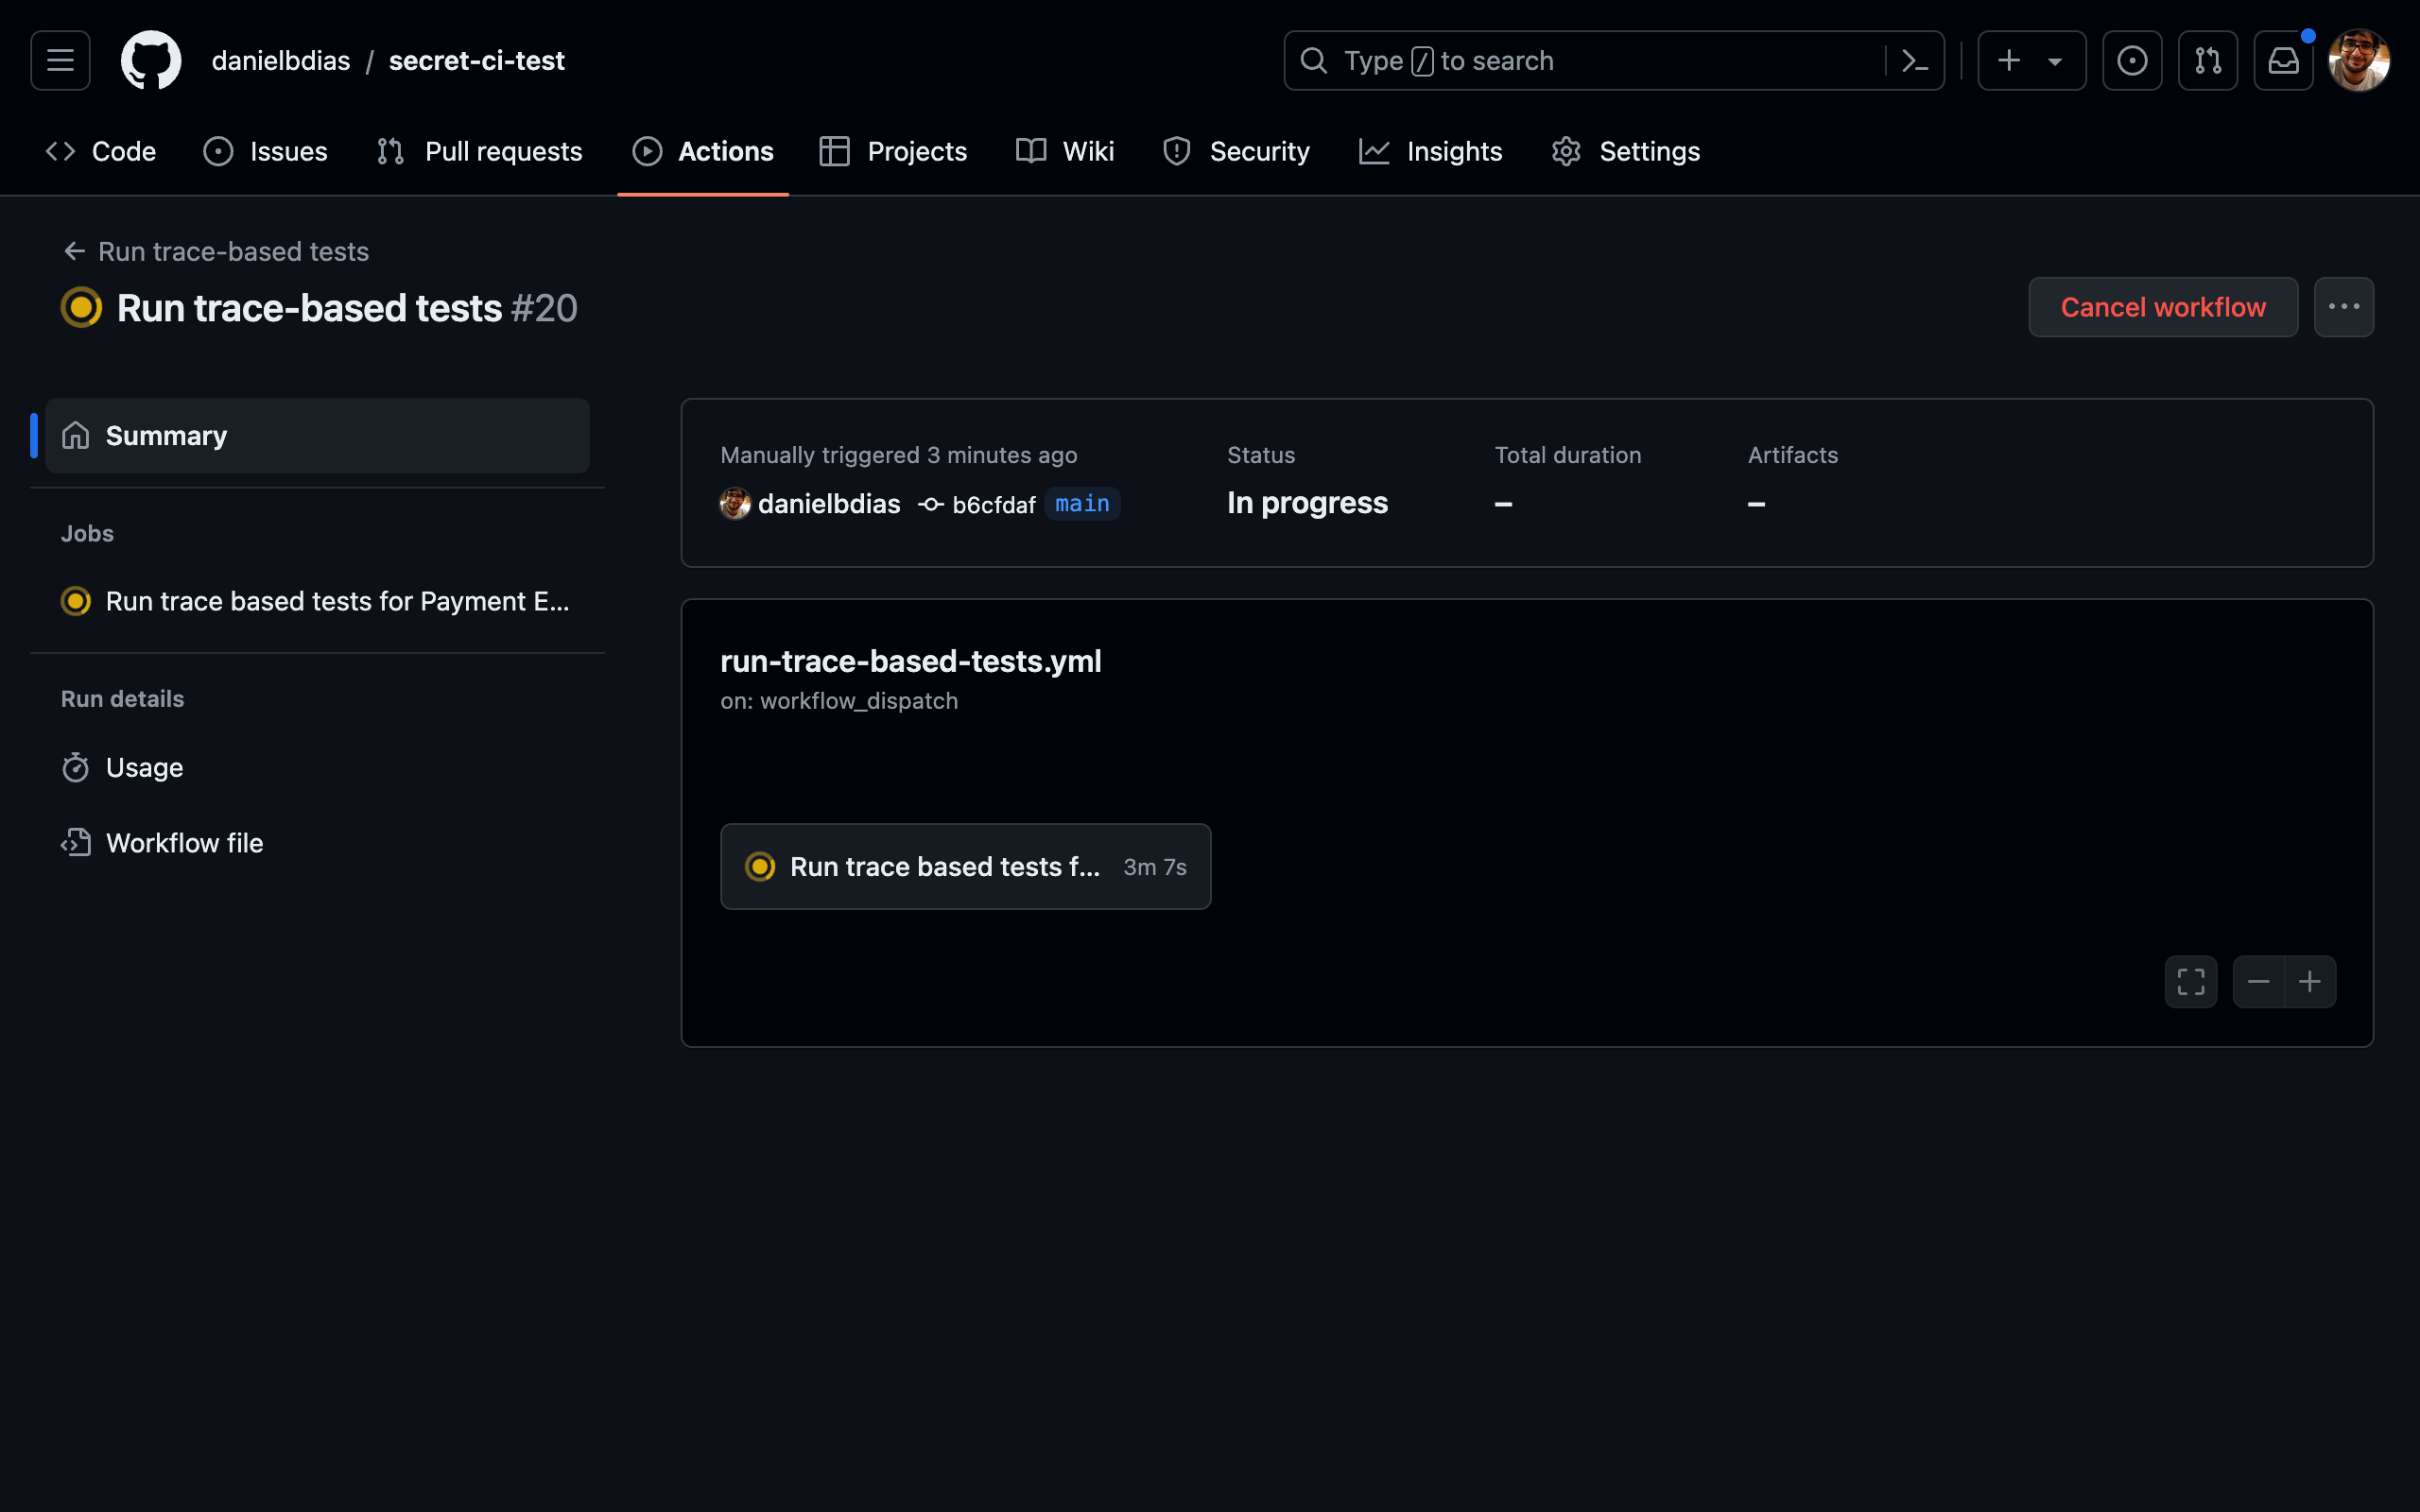
After a while, you can go to the "Actions" on Github and see the workflow running, as shown below.

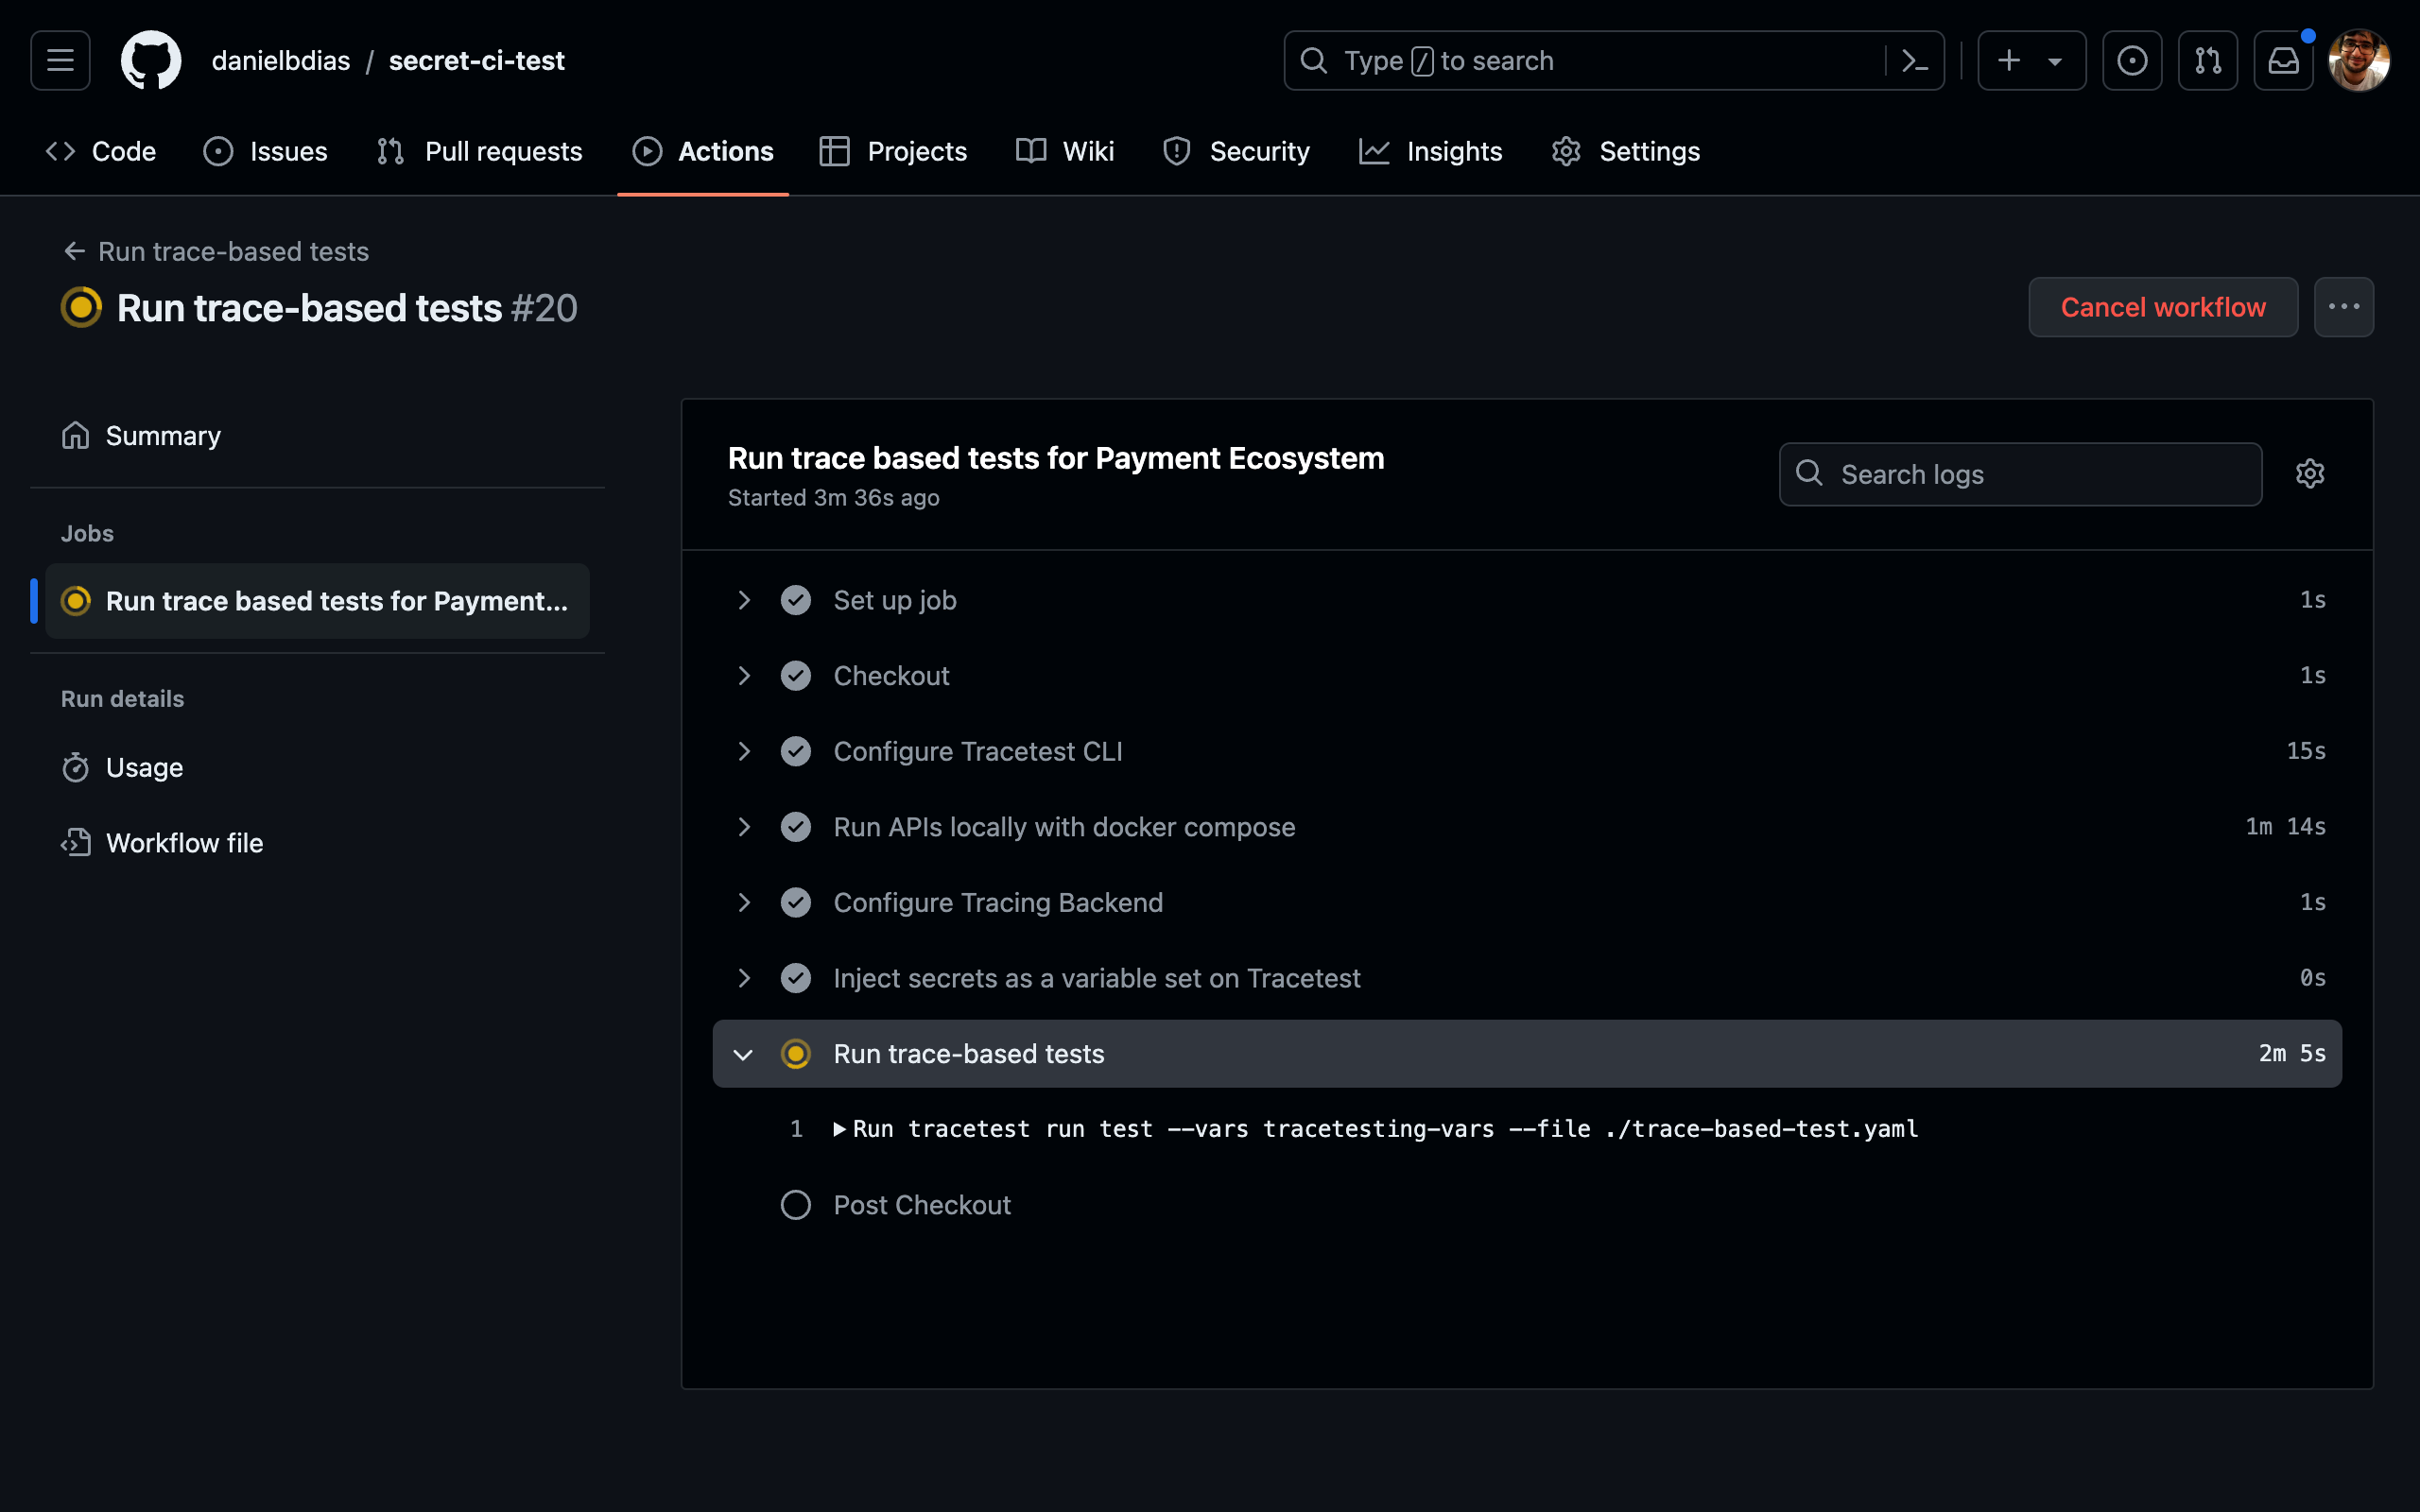
Drill down to see the jobs contained in this workflow.
You can also see the execution of this workflow.
Once it's finished, you can see the results of the test in the Tracetest Web UI by going to your environment on app.tracetest.io and clicking on "Runs".
Learn More
Please visit our examples in GitHub and join our Slack Community for more info!